










Vegorama more than doubled FY24-FY26 revenue, margin rose
Key highlights
- Vegorama's revenue from operations rose from Rs 65.95 crore in FY24 to Rs 140.87 crore in FY26.
- Vegorama's detailed historical income statement reports EBITDA margin of 12.05% in FY26 versus 9.77% in FY24.
- Vegorama's FY26 PAT was Rs 12.04 crore, compared with Rs 4.64 crore in FY24.
- Vegorama reported H1 FY27 revenue growth of 46.53% year on year to Rs 100.06 crore.
powered by IRIS
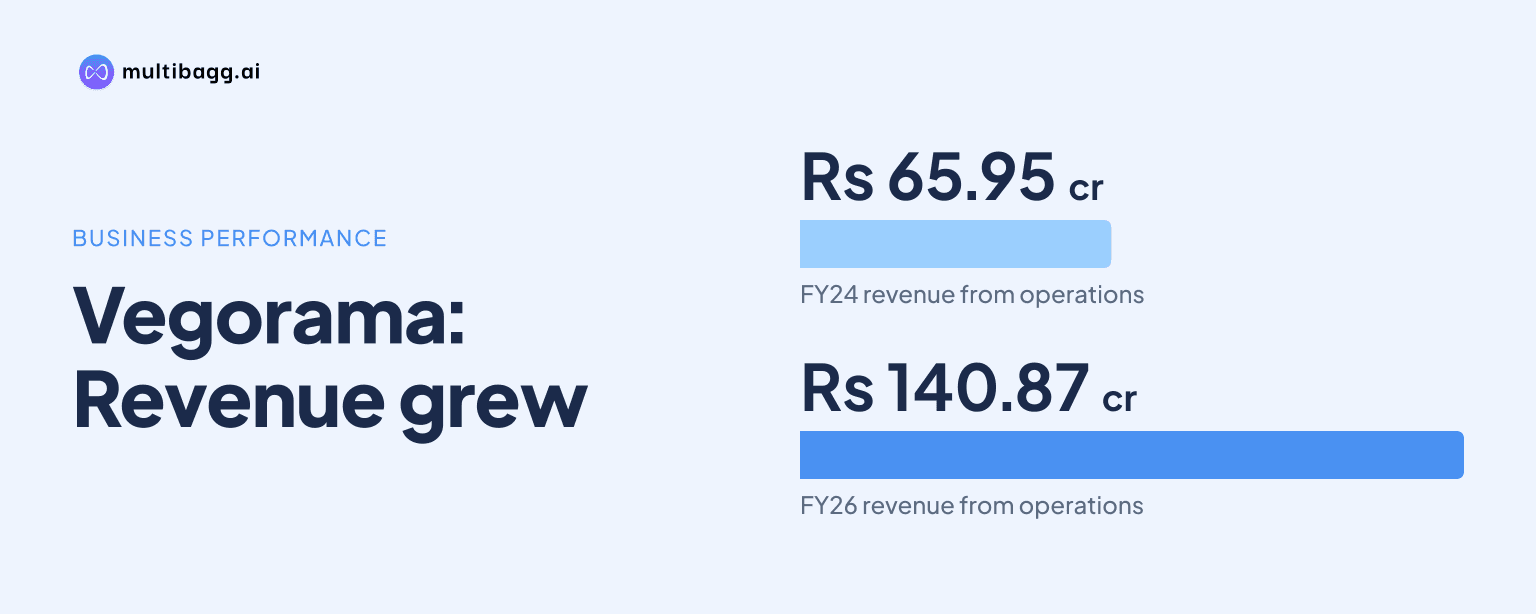
Vegorama increased revenue from operations to Rs 140.87 crore in FY26 from Rs 65.95 crore in FY24, more than doubling over two years, while the detailed historical income statement reports EBITDA margin rising to 12.05% from 9.77%. Profit after tax also increased from Rs 4.64 crore to Rs 12.04 crore over the period.
Know Vegorama Punjabi Angithi inside out
Results, valuation, peers and who's buying, in one view.
How quickly did Vegorama's revenue grow from FY24 to FY26?
Vegorama's revenue from operations increased by Rs 74.92 crore, or 113.6%, from Rs 65.95 crore in FY24 to Rs 101.31 crore in FY25 and Rs 140.87 crore in FY26. The company added Rs 35.36 crore of operating revenue in FY25 and a larger Rs 39.56 crore in FY26, despite a slower percentage growth rate in the second year.
FY25 revenue growth was 53.6% over FY24, while FY26 growth was 39.1% over FY25. The percentage rate therefore moderated as the revenue base expanded, but the absolute addition rose by Rs 4.20 crore in FY26. The historical financial snapshot separately lists revenue of Rs 65.95 crore, Rs 101.31 crore and Rs 140.87 crore for the same three financial years.
Total income, which includes other income, rose by Rs 75.09 crore between FY24 and FY26, from Rs 66.37 crore to Rs 141.46 crore. Other income was Rs 0.42 crore in FY24, Rs 0.79 crore in FY25 and Rs 0.59 crore in FY26, compared with the Rs 74.92 crore increase in revenue from operations, indicating that operating revenue accounted for most of the reported income growth.
Did Vegorama expand EBITDA margin while revenue increased?
Yes. Vegorama's detailed historical income statement reports EBITDA, or earnings before interest, tax, depreciation and amortisation, margin of 9.77% in FY24, 11.35% in FY25 and 12.05% in FY26. That represents an improvement of 2.28 percentage points, or 228 basis points, between FY24 and FY26 alongside the increase in total income.
EBITDA rose from Rs 6.49 crore in FY24 to Rs 11.59 crore in FY25 and Rs 17.05 crore in FY26. The Rs 5.47 crore EBITDA increase in FY26 was greater than the Rs 5.10 crore increase in FY25, and EBITDA grew faster than total income in each year. This relationship is consistent with the margin movement reported in the detailed statement.
The presentation contains a difference between its summary snapshot and detailed income statement for the FY24 EBITDA series. The snapshot reports FY24 EBITDA of Rs 6.04 crore and margin of 9.17%, versus Rs 6.49 crore and 9.77% in the detailed statement; it reports FY26 margin of 12.11%, versus 12.05% in the statement. This analysis uses the detailed statement consistently for the FY24-to-FY26 comparison.
Got a follow-up? Ask IRIS
Which expenses changed as Vegorama scaled up?
Vegorama's cost of materials consumed increased from Rs 34.90 crore in FY24 to Rs 50.58 crore in FY25 and Rs 67.42 crore in FY26. Materials represented about 52.6% of FY24 total income and about 47.7% in FY26, calculated from the reported expense and total-income figures. The decline in this share coincided with the reported EBITDA-margin increase from 9.77% to 12.05%.
Employee benefits expense rose from Rs 5.37 crore in FY24 to Rs 8.08 crore in FY25 and Rs 10.78 crore in FY26. As a proportion of total income, it moved from about 8.1% in FY24 to about 7.6% in FY26. The presentation does not provide an explanation for the change, but it records the lower proportion alongside revenue growth of Rs 74.92 crore across the two years.
Other expenses grew from Rs 19.61 crore in FY24 to Rs 31.86 crore in FY25 and Rs 46.21 crore in FY26. Total expenses consequently increased by Rs 64.53 crore, from Rs 59.88 crore to Rs 124.41 crore, while total income rose by Rs 75.09 crore. The resulting gap between total income and total expenses widened from Rs 6.49 crore to Rs 17.05 crore, matching reported EBITDA.
How did Vegorama's higher EBITDA translate into profit after tax?
Vegorama's profit after tax, or PAT, rose from Rs 4.64 crore in FY24 to Rs 8.18 crore in FY25 and Rs 12.04 crore in FY26. The detailed income statement reports PAT margin of 6.99% in FY24, 8.02% in FY25 and 8.51% in FY26, a 1.52-percentage-point increase over the two-year period.
Depreciation and amortisation expense increased from Rs 20.23 lakh in FY24 to Rs 28.33 lakh in FY25 and Rs 55.51 lakh in FY26. Finance cost rose from Rs 6.15 lakh in FY24 to Rs 37.59 lakh in FY25 before declining slightly to Rs 37.29 lakh in FY26. Even with the higher FY26 depreciation charge, earnings before interest and tax reached Rs 16.50 crore, compared with Rs 6.28 crore in FY24.
Profit before tax increased from Rs 6.22 crore in FY24 to Rs 10.93 crore in FY25 and Rs 16.05 crore in FY26. Current tax expense rose in parallel, from Rs 1.60 crore to Rs 2.77 crore and Rs 4.04 crore, while diluted earnings per share increased from Rs 3.68 to Rs 6.48 and Rs 9.54. These figures show that the reported increase in EBITDA was retained through the profit-after-tax line despite higher depreciation and tax expense.
What does H1 FY27 show after the FY26 growth record?
Vegorama reported H1 FY27 revenue from operations of Rs 100.06 crore, compared with Rs 68.29 crore in H1 FY26, a year-on-year increase of 46.53%. EBITDA rose 63.59% to Rs 14.63 crore from Rs 8.94 crore, and the H1 FY27 EBITDA margin was 14.62%, compared with 13.10% a year earlier.
H1 FY27 PAT was Rs 10.39 crore, up 62.85% from Rs 6.38 crore in H1 FY26, while PAT margin increased by 104 basis points to 10.39%. The partial-year result cannot be compared directly with full-year FY26 revenue of Rs 140.87 crore, but it provides the presentation's latest disclosed year-on-year operating comparison.
Conclusion
Vegorama's FY24-to-FY26 financial record shows a rise in revenue from operations of Rs 74.92 crore, with the detailed income statement recording EBITDA growth from Rs 6.49 crore to Rs 17.05 crore and margin expansion of 228 basis points. PAT increased by Rs 7.40 crore to Rs 12.04 crore, while reported PAT margin rose from 6.99% to 8.51%.
The next measure to watch is whether the H1 FY27 year-on-year margin movement continues through the rest of FY27. The presentation reports H1 FY27 EBITDA margin of 14.62%, 152 basis points above H1 FY26, while revenue from operations increased 46.53% to Rs 100.06 crore; it does not provide a full-year FY27 target or outlook.