










Venky’s (India) Limited cuts FCR as soya price rises 57%
Key highlights
- Venky’s reduced FCR to 1.50–1.60 from 1.70–1.80, requiring about 200 grams less feed per kg of live weight.
- H1 FY27 soya was Rs 56.8 per kg, up 57% year on year.
- Venky’s Poultry and Poultry Products segment contributes about 50% of revenue, compared with about 40% for Oil Seed.
- Poultry margin was 21% in FY18 and -1% in FY26 as maize moved from Rs 14.2 to Rs 22.3 per kg.
powered by IRIS
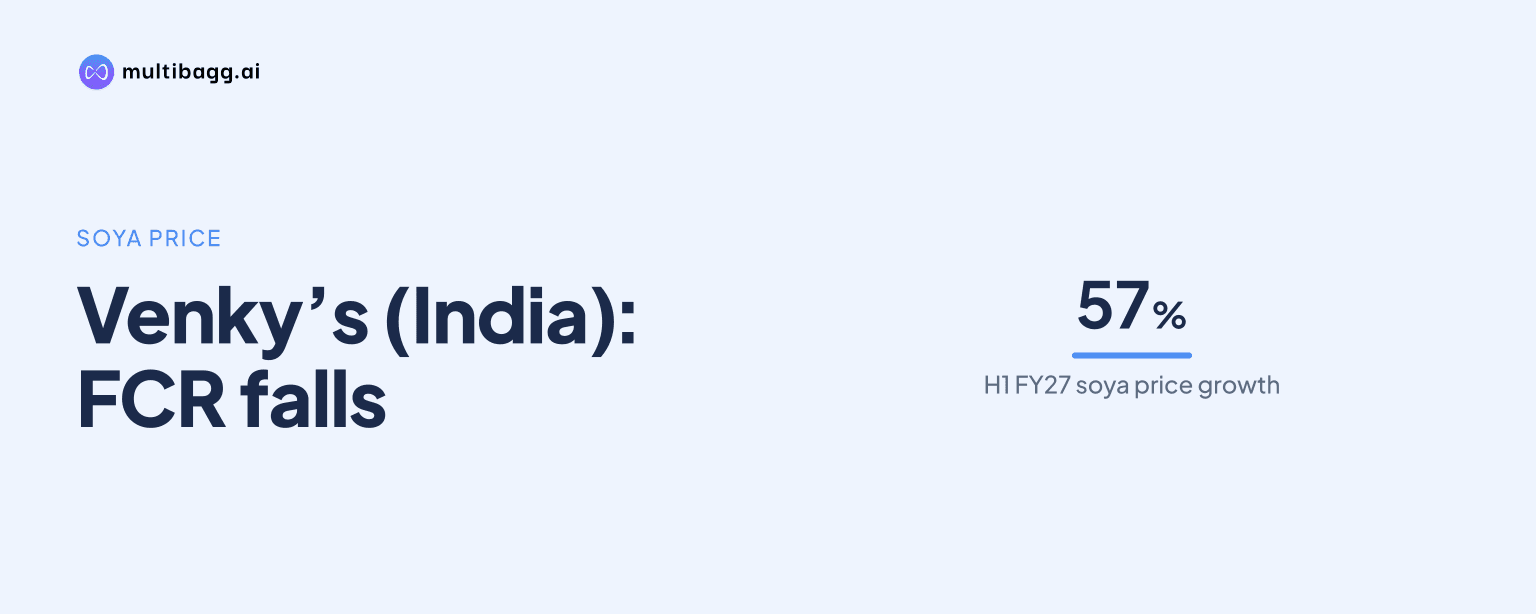
Venky’s (India) Limited reduced its feed conversion ratio to 1.50–1.60 from a historical 1.70–1.80 range alongside H1 FY27 soya prices of Rs 56.8 per kg, up 57% year on year. Venky’s says the lower ratio represents about 200 grams less feed needed for each kilogram of live body weight.
Know Venkys (India) inside out
Results, valuation, peers and who's buying, in one view.
What changed in Venky’s feed conversion ratio?
Venky’s cut its feed conversion ratio, or FCR, to 1.50–1.60 from a historical range of 1.70–1.80. FCR measures the kilograms of feed required to produce one kilogram of live body weight, so the current range indicates about 200 grams less feed per kilogram of bird weight, according to the presentation.
At the midpoint of the disclosed ranges, FCR moved from 1.75 to 1.55, a difference of 0.20 kg of feed per kg of live weight. Venky’s describes its current FCR as at par with international standards and says the efficiency improvement cushions the poultry business against volatile maize and soya costs.
The measure is relevant to Venky’s Poultry and Poultry Products segment, which contributes about 50% of revenue. Its products include broiler and layer day-old chicks, hatchery eggs, commercial broilers, processed chicken, poultry feed and specific-pathogen-free, or SPF, eggs; the Oil Seed segment contributes about 40% of revenue and Animal Health Products about 10%.
Why does lower FCR matter when soya prices rise?
Lower FCR matters because it reduces the quantity of feed needed for each kilogram of live weight when feed ingredients become more costly. Venky’s reported a soya price of Rs 56.8 per kg in H1 FY27, up 57% year on year, and identified this increase as a reason that the FCR gain is critical.
Soya prices have been more variable than maize in the displayed FY16 to H1 FY27 series. Soya rose from Rs 35.5 per kg in FY16 to Rs 66.2 per kg in FY22, then fell to Rs 37.9 per kg in FY25 before reaching Rs 56.8 per kg in H1 FY27. The latest figure followed a 1% increase to Rs 38.3 per kg in FY26.
Maize was Rs 24.0 per kg in H1 FY27, with the presentation showing a 2% year-on-year decline for the partial period. Its price ranged from Rs 14.2 per kg in FY18 to Rs 25.4 per kg in FY25. FCR does not determine commodity prices, but it affects feed volume across Venky’s commercial rearing and live-bird operations.
Got a follow-up? Ask IRIS
How have feed prices and poultry margins compared?
Venky’s data show poultry margins above 20% in FY18 and FY21, when maize prices were below Rs 15 per kg, while margins were 5% or lower in the cited years when maize exceeded Rs 21 per kg. The company defines segment margin as profit before interest and tax, or PBIT, divided by segment revenue.
In FY18, maize was Rs 14.2 per kg and the poultry margin was 21%; in FY21, maize was Rs 14.5 per kg and the margin was 20%. By comparison, maize was Rs 21.9 per kg in FY20, Rs 23.9 per kg in FY23, Rs 22.3 per kg in FY24 and FY26, and Rs 25.4 per kg in FY25, while margins in those years were -8%, 0%, 3%, 5% and -1%, respectively.
The presentation shows an association between feed prices and margins rather than evidence that maize alone determines profitability. FY22, for example, recorded maize at Rs 19.2 per kg and a poultry margin of 3%. H1 FY27 combines maize at Rs 24.0 per kg with soya at Rs 56.8 per kg, while the period’s poultry margin remains to be reported.
What operating structure supports Venky’s feed efficiency?
Venky’s operates breeder farms, commercial farms, feed mills and hatcheries across 11 states, linking breeding, chick production, rearing and feed supply. Haryana has 8 breeder farms, 4 commercial farms, 3 feed mills and 6 hatcheries, while Maharashtra has 5 breeder farms, 2 feed mills, 3 hatcheries and 3 oil-extraction facilities.
The company says the majority of its farms, hatcheries and feed mills are on company-owned land, although some are rented. All commercial farms operate through contract broiler farming and are not on company-owned land. Punjab has the largest disclosed commercial-farm count at 13, compared with 6 in Rajasthan, 4 in Haryana and 2 each in Himachal Pradesh and Uttar Pradesh.
Venky’s Oil Seed segment processes raw soya seeds into refined edible soya oil and de-oiled cake, or DOC. The disclosed output yield is 18% refined edible oil and 82% DOC. Venky’s identifies DOC as a protein-rich input for poultry feed, while refined oil is sold in the market, combining feed-input supply with external product revenue.
Conclusion
Venky’s FCR range of 1.50–1.60 is 0.20 kg below the midpoint of its historical 1.70–1.80 range and represents about 200 grams less feed per kilogram of live weight. That efficiency is particularly relevant as H1 FY27 soya reached Rs 56.8 per kg, up 57% year on year, in a poultry segment that represents about half of revenue.
The next disclosed item to watch is the H1 FY27 poultry segment margin, which Venky’s marks as yet to be reported. The presentation defines H1 FY27 as April to September 2026, and further changes in maize from Rs 24.0 per kg or soya from Rs 56.8 per kg would provide context for how the stated FCR range is working through the poultry business.