










VTM EBITDA margin reaches 7.1% as material ratio drops
Key highlights
- VTM’s Q2 FY27 EBITDA margin was 7.1%, compared with 5.6% in Q2 FY26 and 5.9% in Q1 FY27.
- VTM’s materials ratio fell to 59.8% of Q2 FY27 sales from 65.0% a year earlier and 67.9% in Q1 FY27.
- VTM’s Q2 FY27 net sales were Rs 98.1653 crore, up 9.2% year on year but down 0.2% sequentially.
- VTM’s Q2 FY27 profit after tax was Rs 2.939 crore, up 26.6% year on year and 52.1% quarter on quarter.
powered by IRIS
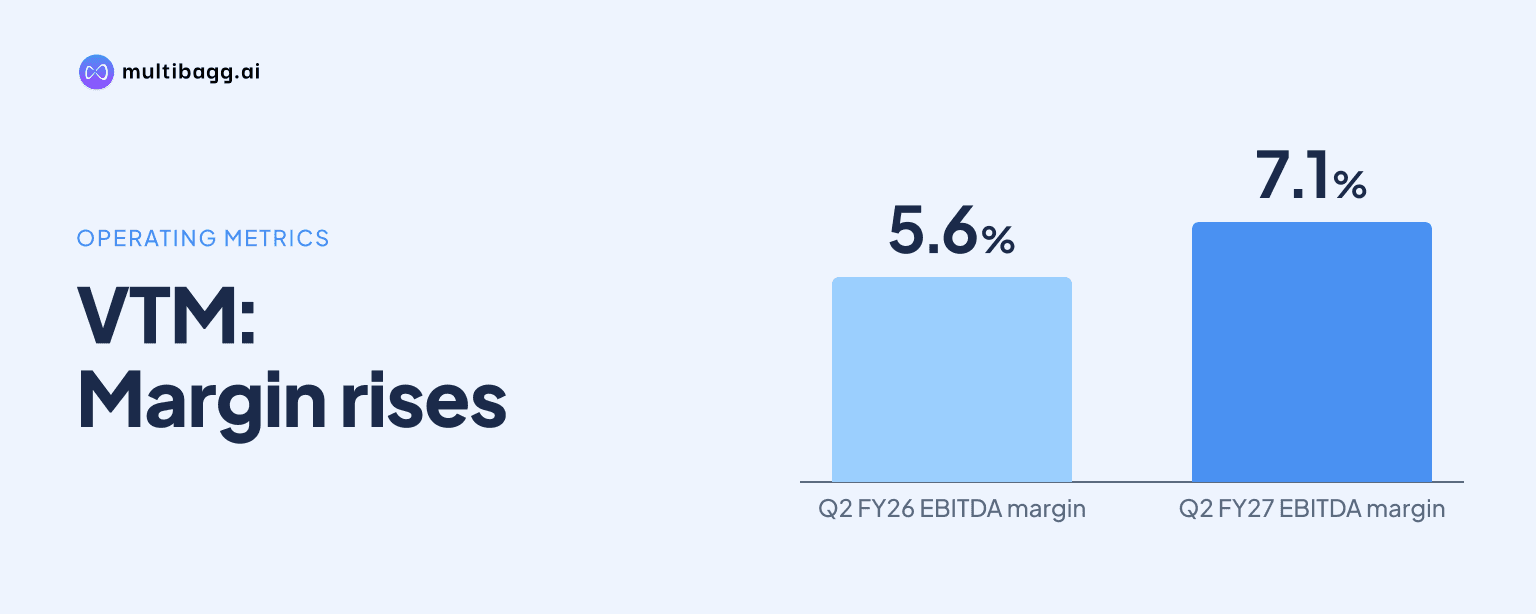
VTM Limited reported a 7.1% EBITDA margin in Q2 FY27, versus 5.6% a year earlier, after materials fell 516 basis points to 59.8% of net sales; management attributed the reduction to product mix. Net sales were nearly flat sequentially at Rs 98.1653 crore, down 0.2%.
Know VTM inside out
Results, valuation, peers and who's buying, in one view.
How did VTM improve its Q2 FY27 margin?
VTM improved its Q2 FY27 margin as earnings before interest, tax, depreciation and amortisation, or EBITDA, rose 38.9% year on year to Rs 6.9359 crore from Rs 4.9952 crore. EBITDA also increased 19.0% from Rs 5.8295 crore in Q1 FY27, lifting the margin by 151 basis points year on year and 114 basis points quarter on quarter to 7.1%. VTM calculates EBITDA excluding other income.
The principal movement was gross margin, which VTM defines as net sales less materials consumed after inventory changes. Gross margin reached Rs 39.4672 crore, up 25.3% year on year and 24.8% from Q1 FY27. The gross-margin percentage was 40.2%, against 35.0% in Q2 FY26 and 32.1% in Q1 FY27, even as net sales rose 9.2% year on year but declined 0.2% sequentially.
Why did VTM’s material cost ratio decline?
VTM’s material cost ratio declined because management attributed the change to the quarter’s product mix. Materials, net of inventory change, were Rs 58.6981 crore in Q2 FY27, only 0.5% above Rs 58.3781 crore a year earlier while sales grew 9.2%. Materials therefore represented 59.8% of sales, compared with 65.0% in Q2 FY26, a 516-basis-point year-on-year reduction.
The sequential movement was larger, with materials declining 12.1% from Rs 66.791 crore in Q1 FY27 while net sales fell by Rs 23.88 lakh. Material intensity consequently decreased from 67.9% in Q1 FY27 to 59.8% in Q2 FY27, or 808 basis points. VTM defines materials, net, as cost of materials consumed plus changes in inventories of finished goods, work in progress and stock in trade.
Q2 FY27 material intensity was also below the FY26 ratio of 62.9%, while the 40.2% gross margin exceeded FY26’s 37.1%. The presentation does not disclose product-wise volumes, pricing or the product categories behind the mix shift. It therefore identifies management’s stated explanation but does not quantify the contribution of individual products.
Which costs limited VTM’s EBITDA conversion?
VTM’s other expenses and employee benefits absorbed part of the Q2 FY27 gross-margin improvement. Other expenses rose 21.6% year on year to Rs 24.1933 crore and 39.2% from Rs 17.384 crore in Q1 FY27. Management said the increase represented additional selling and distribution spending to retain existing customers and explore new markets; other expenses were 24.6% of sales, against 22.1% a year earlier.
Employee benefits increased 26.1% year on year to Rs 8.338 crore, although they were 0.7% below Rs 8.3996 crore in Q1 FY27. Employee benefits were 8.5% of sales in both FY27 quarters, compared with 7.4% in Q2 FY26. Management attributed the year-on-year increase to human-resource additions and the impact of labour-code compliance changes.
Got a follow-up? Ask IRIS
How did fixed charges affect VTM’s Q2 profit?
VTM’s profit before tax before exceptional items rose 24.8% year on year to Rs 3.6305 crore, slower than EBITDA growth because depreciation and amortisation and finance cost increased. Depreciation and amortisation rose 25.8% to Rs 3.5859 crore, while finance cost increased 116.2% to Rs 86.05 lakh from Rs 39.80 lakh. Both charges were also higher than the Rs 3.0737 crore and Rs 79.91 lakh reported in Q1 FY27.
Other income partly offset the higher charges, increasing to Rs 1.141 crore from Rs 63.67 lakh in Q1 FY27, although it was below Rs 1.1641 crore in Q2 FY26. VTM’s reconciliation shows that EBITDA of Rs 6.9359 crore, plus other income and less depreciation, amortisation and finance cost, equals reported pre-tax profit of Rs 3.6305 crore. There were no exceptional items in Q2 FY27, Q1 FY27 or Q2 FY26.
Profit after tax was Rs 2.939 crore, up 26.6% year on year and 52.1% sequentially, with a 3.0% margin. That matched the FY26 profit-after-tax margin of 3.0%, compared with 2.6% in Q2 FY26 and 2.0% in Q1 FY27. Total comprehensive income rose only 4.6% year on year to Rs 3.7122 crore because other comprehensive income declined to Rs 77.32 lakh from Rs 1.2261 crore.
What does VTM’s Q2 FY27 result show?
VTM’s Q2 FY27 result shows that the EBITDA-margin recovery came from lower material intensity rather than sequential sales growth. Net sales were Rs 23.88 lakh below Q1 FY27, but gross margin increased by Rs 7.8541 crore and EBITDA by Rs 1.1064 crore. In VTM’s year-on-year EBITDA bridge, sales added Rs 8.2894 crore, while higher employee and other expenses reduced EBITDA by Rs 1.7269 crore and Rs 4.3018 crore, respectively.
The quarter and six-month financial results ended September 30, 2026 were unaudited, though VTM said its statutory auditors issued an unmodified limited-review report. Basic earnings per share, not annualised, were Rs 0.29 in Q2 FY27, compared with Rs 0.23 in Q2 FY26 and Rs 0.19 in Q1 FY27. The FY26 EBITDA margin was 7.5%, or 40 basis points above the Q2 FY27 figure.
Conclusion
VTM combined almost flat sequential revenue with a substantial shift in its reported cost structure. Materials fell to 59.8% of sales from 67.9% in Q1 FY27, supporting the increase in EBITDA margin to 7.1%, while higher selling, distribution and employee costs absorbed part of the gross-margin expansion. Higher depreciation, amortisation and finance cost then moderated growth in pre-tax profit.
The unresolved issue for subsequent quarters is whether the product mix cited by management can keep material intensity below FY26’s 62.9% while other expenses remain at 24.6% of sales. VTM disclosed no margin target or formal outlook, and identified raw-material prices, domestic and export textile demand, foreign-exchange movements and regulatory changes as factors that could affect future results.