










Wakefit lifts operating EBITDA margin to 7.9% in H1FY27
Key highlights
- Wakefit’s operating EBITDA margin increased from negative 13.9% in FY23 to 7.9% in H1FY27.
- Wakefit’s FY26 revenue from operations was Rs 1,488.94 crore, up from Rs 812.62 crore in FY23.
- Furniture revenue grew at a 30.7% compound annual growth rate from Rs 195.11 crore in FY23 to Rs 435.75 crore in FY26.
- Wakefit’s net working-capital days declined from 20.4 in FY23 to negative 0.9 in H1FY27.
powered by IRIS
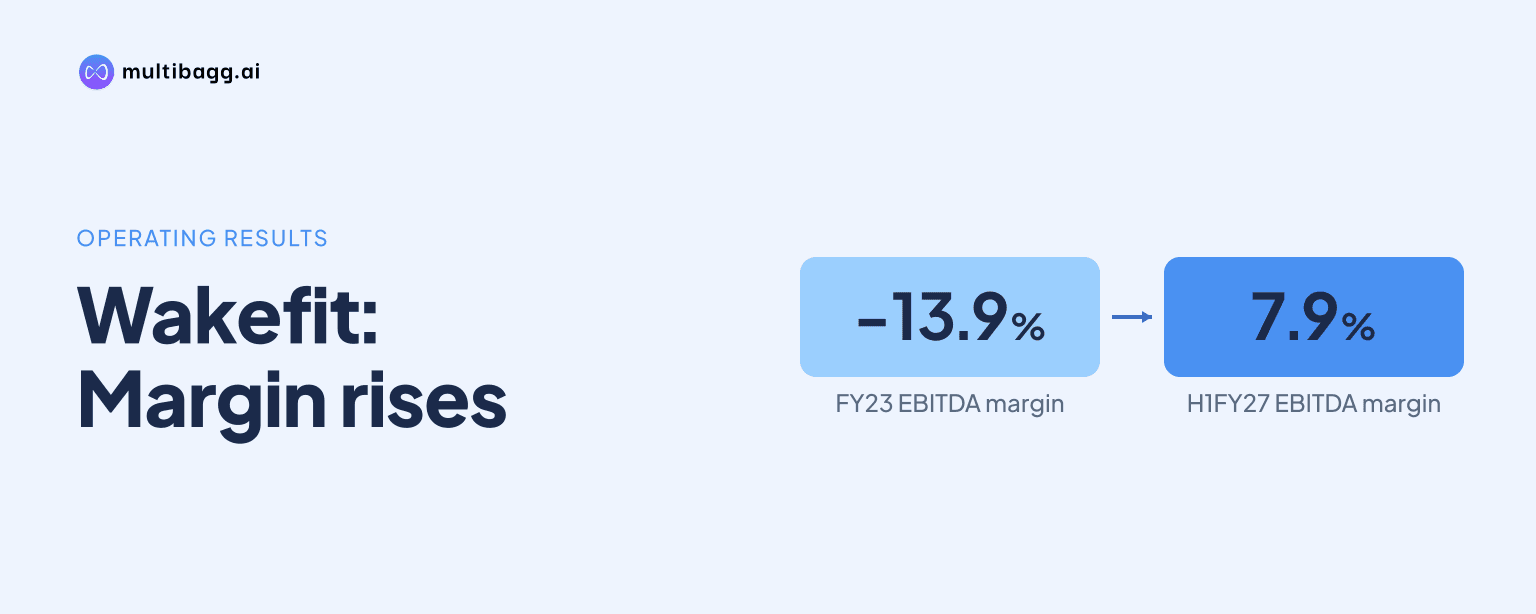
Wakefit reported a 7.9% operating EBITDA margin in H1FY27, compared with negative 13.9% in FY23, as revenue from operations reached Rs 856.90 crore and operating EBITDA reached Rs 67.33 crore. Revenue growth in mattresses and furniture accompanied the margin change, while net working-capital days moved to negative 0.9.
Know Wakefit Innovations inside out
Results, valuation, peers and who's buying, in one view.
How did Wakefit's operating EBITDA margin change?
Wakefit moved from an operating EBITDA loss of Rs 112.94 crore in FY23 to Rs 67.33 crore of operating EBITDA at a 7.9% margin in H1FY27. Operating EBITDA means earnings before interest, taxes, depreciation and amortisation before lease adjustments, employee stock option plan charges, and other non-operating or one-time income and expenses.
The margin rose progressively through the disclosed periods, reaching 1.0% in FY24, 1.4% in FY25 and 7.5% in FY26 before reaching 7.9% in H1FY27. The H1FY27 result covers a half year, so its Rs 67.33 crore operating EBITDA is not directly comparable in absolute terms with FY26 operating EBITDA of Rs 112.26 crore.
Wakefit's reported EBITDA differs from its operating EBITDA measure. Reported EBITDA was Rs 181.96 crore in FY26, or a 12% margin, compared with operating EBITDA of Rs 112.26 crore and a 7.5% margin after the stated adjustments.
How fast has Wakefit's revenue expanded?
Wakefit increased revenue from operations from Rs 812.62 crore in FY23 to Rs 1,488.94 crore in FY26, representing the stated 22.4% compound annual growth rate. Annual revenue growth was 28% in FY23, 21% in FY24, 29% in FY25 and 17% in FY26, so the reported growth rate moderated in FY26 while revenue still increased.
H1FY27 revenue was Rs 856.90 crore, more than half of FY26 revenue, but no corresponding H1FY26 revenue is disclosed. This permits comparison with prior full-year figures for scale, but not a source-based half-year growth calculation.
Total unit volume increased from 19,20,384 in FY23 to 29,01,375 in FY26. The number of stores labelled COCO in the presentation rose from 23 to 139 during the same period.
Which Wakefit categories contributed most to growth?
Wakefit's mattresses category remained its largest revenue contributor, increasing from Rs 515.98 crore in FY23 to Rs 913.87 crore in FY26 at a stated 20.9% compound annual growth rate. FY26 mattress revenue exceeded furniture revenue of Rs 435.75 crore and furnishings revenue of Rs 139.32 crore.
Furniture was the fastest-growing disclosed category between FY23 and FY26, with a stated 30.7% compound annual growth rate. Its revenue rose from Rs 195.11 crore to Rs 435.75 crore, while unit volume increased from 1,78,488 to 4,20,001.
Furnishings revenue rose at a stated 11.1% compound annual growth rate from Rs 101.53 crore in FY23 to Rs 139.32 crore in FY26. Unlike the other two categories, furnishings revenue declined slightly from Rs 140.63 crore in FY25, although unit volume rose from 14,55,037 to 15,65,972 in FY26.
Got a follow-up? Ask IRIS
What changed in Wakefit's working capital and cash flow?
Wakefit reduced net working-capital days from 20.4 in FY23 to 2.2 in FY26 and negative 0.9 in H1FY27. The metric is calculated as average net working capital divided by revenue from operations, multiplied by 365; net working capital is inventory plus trade receivables minus trade payables.
At H1FY27, inventory was Rs 325.22 crore and trade receivables were Rs 3.18 crore, while trade payables were Rs 332.56 crore. Those closing balances are consistent with a negative working-capital position, although the disclosed days calculation uses average balances rather than period-end balances.
Net cash from operating activities was Rs 38.84 crore in the period labelled September 2026, compared with Rs 244.53 crore in March 2026. The September 2026 period included a Rs 64.41 crore working-capital outflow, whereas the March 2026 statement showed a Rs 55.84 crore working-capital inflow; the periods are of different lengths.
How is Wakefit funding store expansion?
Wakefit listed on the National Stock Exchange and BSE in December 2025 with Rs 1,208.90 crore of initial public offering proceeds. The offering comprised Rs 377.20 crore of primary issuance and Rs 911.70 crore of offer for sale, meaning the primary issuance was the component raising new capital for Wakefit.
Wakefit disclosed Rs 30.84 crore of planned capital expenditure for 117 new COCO regular stores and Rs 161.47 crore for lease, sub-lease rent and licence-fee payments for existing COCO regular stores. Other disclosed allocations include Rs 108.40 crore for marketing and advertising, Rs 15.41 crore for equipment and machinery, and Rs 33.07 crore for general corporate purposes.
The store plan follows an increase to 139 COCO stores in FY26 from 105 in FY25. At H1FY27, Wakefit reported Rs 293.64 crore of right-of-use assets, Rs 242.35 crore of non-current lease liabilities and Rs 89.77 crore of current lease liabilities.
Conclusion
Wakefit's disclosed figures show a shift from an operating EBITDA loss of Rs 112.94 crore and a negative 13.9% margin in FY23 to a 7.9% operating EBITDA margin in H1FY27. The change occurred alongside FY23-to-FY26 revenue growth of Rs 676.32 crore, faster furniture expansion than mattresses or furnishings, and net working-capital days falling by 21.3 days to negative 0.9.
The next disclosed execution points are the planned 117 new COCO regular stores, the Rs 161.47 crore allocation for existing-store lease-related payments, and the subsequent revenue and operating EBITDA outcome after H1FY27. Management's stated plans also include expanding COCO stores, increasing website sales, scaling product categories, and using technology to improve customer experience and operational efficiency.