










WOL 3D India Ltd H1 FY27 Revenue Rises 118% to Rs 907 Million
Key highlights
- WOL 3D India Ltd reported H1 FY27 revenue of Rs 907 million, up 118% year on year.
- EBITDA rose 75% to Rs 81 million, while EBITDA margin declined to 8.9% from 11.1%.
- Net profit increased 71.1% year on year to Rs 65 million in H1 FY27.
- Operating cash outflow was Rs 42.1 million and inventory rose to Rs 618.5 million.
powered by IRIS
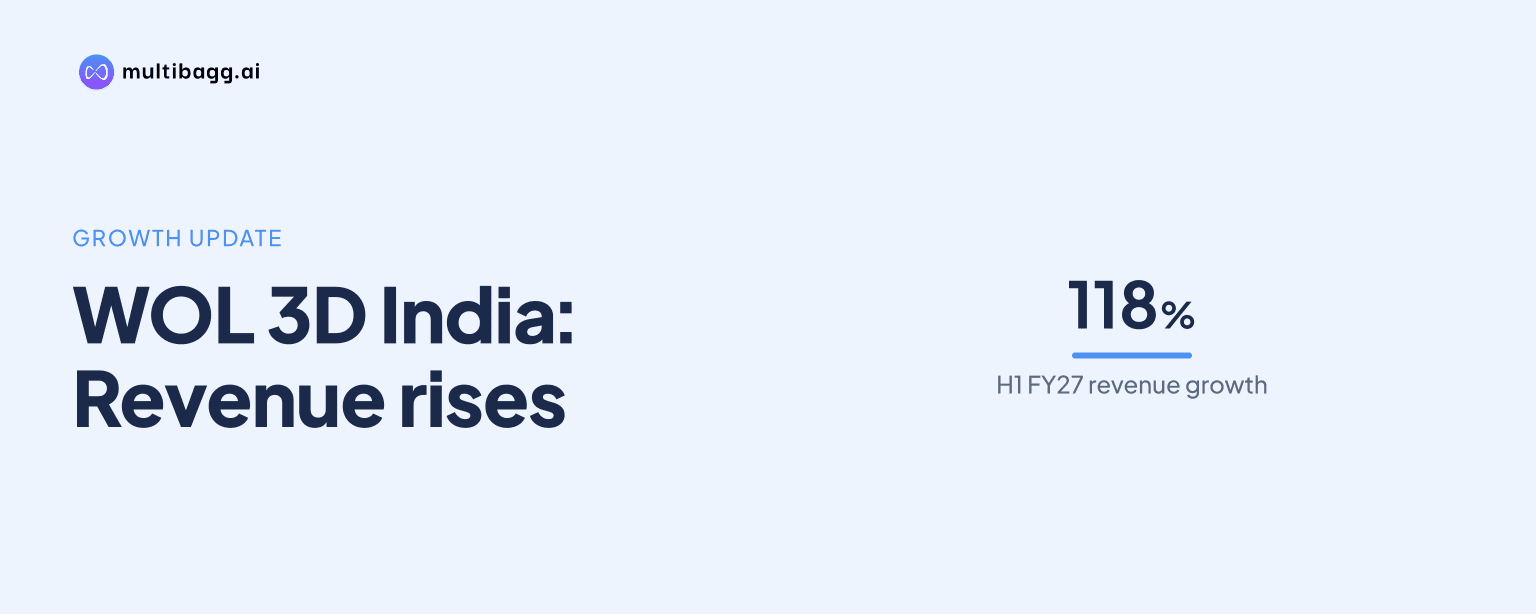
WOL 3D India Ltd reported H1 FY27 revenue from operations of Rs 907 million, up 118% year on year, while EBITDA increased 75% to Rs 81 million and EBITDA margin fell to 8.9% from 11.1% due to front-loaded expansion expenditure. The results highlight strong demand growth alongside higher working-capital and operating costs.
Know WOL 3D India inside out
Results, valuation, peers and who's buying, in one view.
What did WOL 3D India Ltd report for H1 FY27?
WOL 3D India Ltd reported revenue from operations of Rs 907 million for the six months ended September 2026, compared with Rs 416 million in H1 FY26. Total income was Rs 923 million, including Rs 16 million of other income. Net profit was Rs 65 million, up 71.1% year on year from Rs 38 million.
The company disclosed EBITDA of Rs 81 million, a 75% year-on-year increase. However, EBITDA margin declined to 8.9% from 11.1% in the corresponding prior-year period. In its investor presentation, WOL 3D India attributed the margin moderation to expenses incurred ahead of expansion and new growth initiatives.
The financial results were filed with the National Stock Exchange on November 14, 2026, and the investor presentation was disclosed on November 16, 2026. The figures are standalone results for the April to September 2026 period.
Which business lines drove WOL 3D India's revenue growth?
WOL 3D India said growth was broad-based across its reported business lines. Hardware revenue rose 120% year on year, consumables revenue increased 104%, prototyping revenue grew 133%, and other services rose 75%. The company linked its demand outlook to increasing awareness and adoption of 3D printing across a broad consumer base.
The faster growth in prototyping and hardware indicates that the expansion was not limited to a single product category. Consumables also remained an important contributor, with sales rising at more than double the previous year's level. The presentation did not provide absolute revenue figures for individual segments.
WOL 3D India also reported that its filament capacity has reached 400 tonnes. The company plans a retail rollout, although the presentation did not state a date, investment amount, or expected sales contribution from that initiative. Investors therefore have a disclosed operational milestone but no quantified near-term revenue guidance from management.
Why did WOL 3D India's EBITDA margin decline?
WOL 3D India's EBITDA margin declined because the company front-loaded spending related to expansion, even as operating profit rose in absolute terms. EBITDA grew 75% to Rs 81 million, but this pace was below the 118% increase in revenue, resulting in the margin falling to 8.9%.
The company had indicated a similar pattern in H1 FY26, when it described higher employee costs and expansion-related investments for new product verticals as factors affecting profitability. In the latest presentation, management again cited front-loaded expenses while expressing confidence in business momentum during H2 FY27 and in margin recovery as scale increases.
That expectation was not accompanied by numerical margin, revenue, EBITDA, or profit guidance. The presentation therefore establishes management's direction of travel but does not provide a target against which investors can assess H2 FY27 performance.
Got a follow-up? Ask IRIS
What do cash flow and inventory figures indicate?
WOL 3D India reported an operating cash outflow of Rs 42.1 million for H1 FY27. At the same time, inventory rose to Rs 618.5 million. These figures point to a larger amount of cash being tied up in working capital while the company expands sales, product availability, and operations.
Higher inventory can support fulfilment and a wider retail presence, particularly as the company prepares for a filament retail rollout. But the presentation does not provide an inventory turnover ratio, ageing data, or a comparison with the previous period. It is therefore not possible from the disclosed information alone to determine how quickly the higher inventory is expected to convert into sales.
For shareholders, the cash-flow position is relevant because reported net profit and operating cash generation can differ substantially during rapid expansion. WOL 3D India earned Rs 65 million in net profit during H1 FY27, while the period still recorded negative operating cash flow.
How does H1 FY27 compare with WOL 3D India's earlier performance?
WOL 3D India's H1 FY27 revenue of Rs 907 million was more than double the Rs 416 million reported in H1 FY26. In the earlier half-year period, the company had reported 82% year-on-year revenue growth and had also flagged expansion-led pressure on EBITDA margins. The latest result shows that revenue growth accelerated, while margin pressure continued.
The company had previously reported FY26 revenue growth of 102%, according to the material provided. Its latest presentation says it expects momentum to continue through H2 FY27, supported by rising 3D-printing awareness and demand across its consumer base. No full-year FY27 forecast was disclosed.
The board had scheduled its November 14 meeting to consider H1 results and fund-raising proposals. The supplied disclosures confirm the results filing, but do not state whether any fund-raising proposal was approved, its structure, or its amount. That remains an unresolved disclosure point for investors reviewing the company's capital needs alongside inventory growth and operating cash outflow.
Conclusion
WOL 3D India's H1 FY27 presentation shows strong revenue and profit growth, led by gains across hardware, consumables, prototyping, and other services. Revenue reached Rs 907 million and net profit reached Rs 65 million, but EBITDA margin declined to 8.9% and operating cash flow was negative Rs 42.1 million as expansion costs and inventory increased.
Investors will next watch whether H2 FY27 sustains the reported sales momentum, whether scale supports the margin recovery management expects, and how the planned filament retail rollout progresses. Further exchange disclosures on the board's fund-raising consideration, if any, would also clarify the company's financing plans.