










YHPL Q2 revenue rose 81% as EBITDA margin fell 615 bps
Key highlights
- YHPL’s Q2 FY27 revenue rose 81% year on year to Rs 18.0 crore.
- YHPL’s Q2 FY27 EBITDA margin declined 615 basis points to 11.0%.
- YHPL’s trade receivables reached Rs 10.0 crore at H1 FY27, up from Rs 7.5 crore at FY26.
- YHPL generated Rs 4.0 crore of operating cash flow in H1 FY27 after a Rs 3.1 crore outflow in FY26.
powered by IRIS
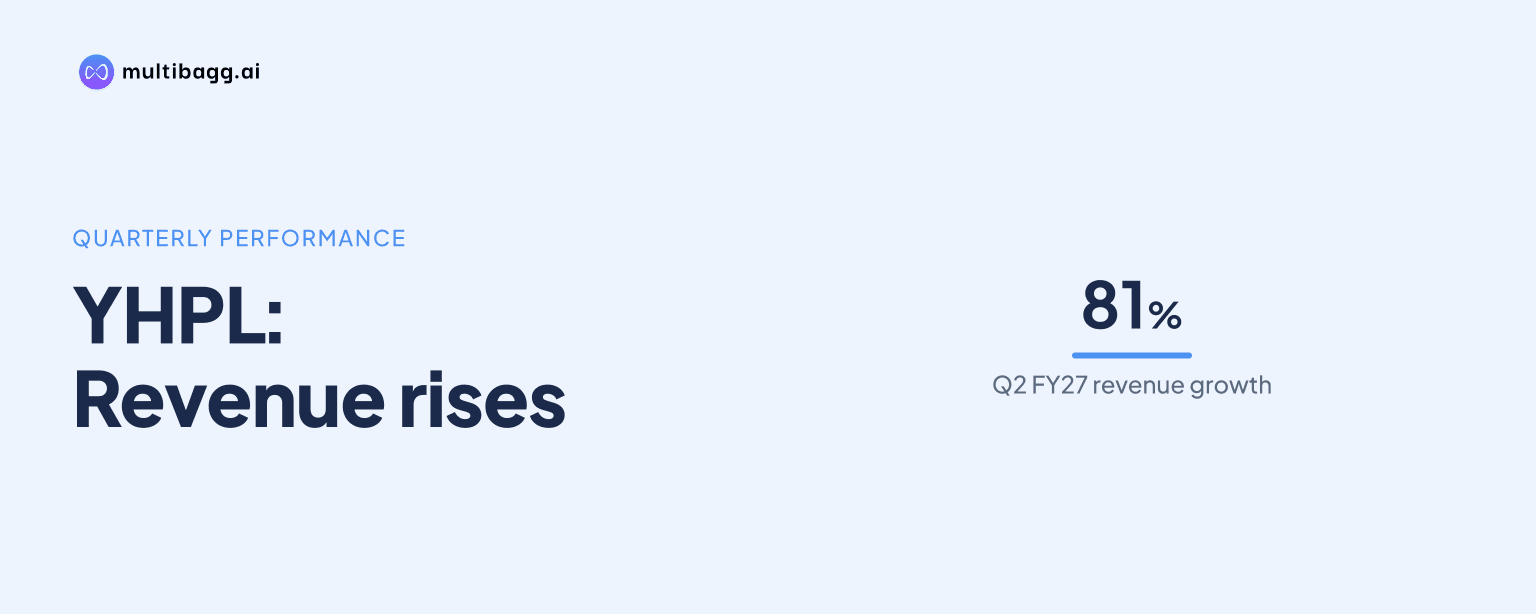
In Q2 FY27, Yuvraaj Hygiene Products Ltd (YHPL) reported revenue of Rs 18.0 crore, up 81% year on year, but earnings before interest, tax, depreciation and amortisation (EBITDA) margin fell 615 basis points to 11.0%, as cost of goods sold rose 131% to Rs 12.5 crore.
Know Yuvraaj Hygiene Products inside out
Results, valuation, peers and who's buying, in one view.
Why did YHPL’s Q2 revenue rise while EBITDA margin fell?
YHPL’s Q2 FY27 revenue increased to Rs 18.0 crore from Rs 9.9 crore in Q2 FY26, while EBITDA rose 16% to Rs 2.0 crore from Rs 1.7 crore. As EBITDA grew more slowly than sales, the EBITDA margin declined to 11.0% from 17.2%, a fall of 615 basis points. One basis point equals one-hundredth of a percentage point.
The reported cost mix changed during the quarter. Cost of goods sold (COGS) increased 131% to Rs 12.5 crore from Rs 5.4 crore, exceeding the 81% increase in revenue. Gross profit rose 22% to Rs 5.5 crore, but gross-profit margin fell 1,486 basis points to 30.8% from 45.7%.
Other expenses increased 54% to Rs 2.8 crore in Q2 FY27 from Rs 1.8 crore a year earlier, while employee benefit expenses declined 26% to Rs 0.7 crore from Rs 1.0 crore. The presentation does not identify a specific operational reason for the increase in COGS or the decline in gross-profit margin.
How did YHPL’s Q2 profit compare with sales growth?
YHPL’s profit after tax (PAT) rose 7% to Rs 1.3 crore in Q2 FY27 from Rs 1.2 crore in Q2 FY26, below the 81% revenue increase. PAT margin declined 484 basis points to 7.0% from 11.8%, while profit before tax increased 32% to Rs 1.5 crore from Rs 1.2 crore.
Tax was Rs 0.3 crore in Q2 FY27, whereas the comparable Q2 FY26 entry was shown as nil. Finance cost was shown as Rs 0.0 crore in both quarters, and depreciation and amortisation declined to Rs 0.4 crore from Rs 0.5 crore. The reported figures therefore show that the wider cost of sales and expense movements outweighed the benefit of higher revenue at the net-profit level.
The quarterly pattern followed a lower annual profit base in FY26. Revenue declined 16% to Rs 38.7 crore in FY26 from Rs 46.3 crore in FY25, while EBITDA fell 18% to Rs 5.7 crore from Rs 6.9 crore. EBITDA margin moved only 28 basis points lower to 14.6% in FY26, but PAT fell 43% to Rs 3.3 crore and PAT margin declined to 8.6% from 12.7%.
Has YHPL’s working capital increased?
Yes. YHPL’s inventories and trade receivables totalled Rs 19.8 crore at H1 FY27, compared with Rs 18.0 crore at FY26 and Rs 7.0 crore at FY25. Trade receivables rose to Rs 10.0 crore at H1 FY27 from Rs 7.5 crore at FY26, while inventories reduced to Rs 9.8 crore from Rs 10.5 crore.
The H1 FY27 balance remained well above the FY25 levels of Rs 4.6 crore for inventories and Rs 2.4 crore for receivables. Trade payables also rose to Rs 8.2 crore at H1 FY27 from Rs 6.8 crore at FY26. Total current assets reached Rs 23.4 crore, against current liabilities of Rs 10.7 crore.
FY26 operating metrics also recorded a longer cash cycle than FY25. Debtor days increased to 47 from 16, inventory days increased to 126 from 58, and payable days increased to 95 from 61. The cash conversion cycle, measuring the time between supplier payment and customer collection, expanded to 79 days in FY26 from 13 days in FY25.
Got a follow-up? Ask IRIS
Did YHPL’s operating cash flow improve in H1 FY27?
Yes. YHPL reported cash from operating activities of Rs 4.0 crore in H1 FY27, compared with an operating cash outflow of Rs 3.1 crore in FY26. This followed operating cash inflows of Rs 0.2 crore in FY24 and Rs 5.7 crore in FY25.
After an investing cash outflow of Rs 0.3 crore and a financing cash outflow of Rs 1.8 crore, cash increased by Rs 2.0 crore in H1 FY27. Closing cash and cash equivalents were Rs 2.7 crore, compared with opening cash of Rs 0.8 crore. The presentation does not provide a cash-flow bridge separating the effects of profit, collections, inventory movements and other operating items.
Balance-sheet funding changed over the same period. Non-current borrowings were Rs 9.9 crore at H1 FY27, down from Rs 11.5 crore at FY26 but above Rs 6.4 crore at FY25. Total liabilities were Rs 21.2 crore at H1 FY27, while equity capital was Rs 7.6 crore.
What is YHPL’s plan for growth and working capital?
Management targets 30% to 40% annual growth in YHPL’s warehousing vertical. Its disclosed plan is to use expansion in e-commerce and quick-commerce dark-store networks, strengthen existing customer relationships including Zepto, Amazon and Flipkart, and develop newer customer accounts.
Management also plans to add stock-keeping units and invest in product-specific dies for product development and portfolio diversification. The company describes its manufacturing model as asset-light, with in-house moulding capabilities complemented by contract-based external job-work facilities.
For working capital, management says it intends to maintain product availability for short customer delivery timelines while aligning inventory levels and funding requirements with customer demand and store-expansion plans. The presentation gives no numerical receivables, inventory-days or cash-conversion-cycle target for FY27.
Conclusion
YHPL’s Q2 FY27 results show that revenue growth of Rs 8.1 crore year on year produced a smaller Rs 0.3 crore increase in EBITDA and a 615-basis-point decline in EBITDA margin. Receivables rose to Rs 10.0 crore at H1 FY27, while the FY26 cash conversion cycle had increased to 79 days, although H1 FY27 operating cash flow turned positive at Rs 4.0 crore.
The next reported periods will show progress against management’s 30% to 40% annual warehousing-growth target and its stated working-capital-management plan. Key disclosed measures to watch are COGS, gross margin, receivables, inventories, operating cash flow and the cash conversion cycle, as the presentation does not disclose a timetable for the target or a cash-flow bridge for H1 FY27.