


Earnings Call/Transcript
Basilic Fly Studio Q2 FY27 Earnings Call Transcript
Basilic Fly Studio submitted the transcript of its earnings call for Q2 and H1 FY27 financial results, held on November 6, 2026.





IRIS
Multibagg AI is an AI powered stock research and analysis platform. We provide data, information, content, and analytics for publicly traded Indian companies listed on NSE and BSE. AI can make mistakes, check important information.
Prices might be delayed by a few minutes.
Join our Exclusive Community


Join our Exclusive Community
Made with 💙 in India. © Finsky Technologies Pvt Ltd. 2026


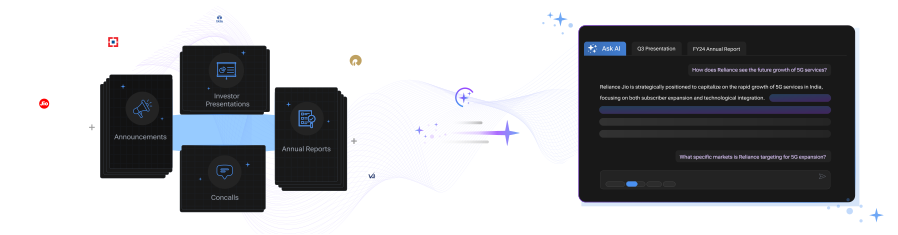
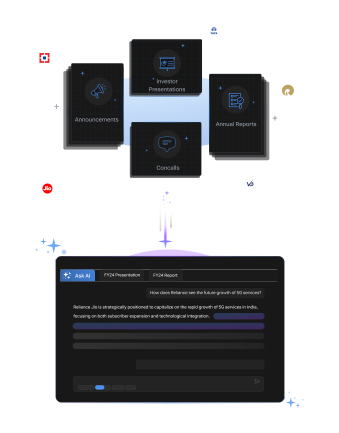
Get instant AI-powered insights about company performance, financials, and strategy. Ask questions about trends, competition, and developments while receiving responses backed by official documents and market data, with clear attribution to source documents.



 Discovery themes featuring this stock



Investor Presentation
Q2 FY27
Investor Presentation
Q1 FY27
Investor Presentation
Q4 FY26
Investor Presentation
Q3 FY26
Investor Presentation
Q2 FY25
Investor Presentation
Q4 FY24
Investor Presentation
Q2 FY24



Basilic Fly Studio is a Chennai-headquartered visual-effects studio delivering 2D and 3D VFX services, including compositing, rotoscopy, tracking, computer graphics, previsualization, onset supervision and animation support for Indian and international film and streaming productions.
The company delivered 81 projects for 52 global clients during Q2 FY27, including marquee titles connected with Netflix, Disney+, Lucasfilm, Warner Bros., Apple TV+ and Sun Network. This unusually broad client mix demonstrates that Basilic is moving beyond a domestic service-provider profile toward a diversified international production platform.
Consolidated Q2 revenue increased 13% year-on-year to Rs. 107 crores, while H1 revenue grew 11% to Rs. 211 crores. However, consolidated EBITDA margin declined to 21% in Q2 and 17.5% in H1 because overseas business expanded faster than the higher-margin Indian segment, creating a near-term profitability trade-off.
Basilic is investing heavily ahead of anticipated scale, including approximately Rs. 22 crores in AI and technology assets, a five-petabyte server platform, hybrid infrastructure and a Bengaluru studio. These investments have increased depreciation and working-capital requirements before their expected benefits are fully reflected in earnings.
The strategic direction is shifting toward larger-ticket international projects, greater Indian offshoring, proprietary editable AI tools and eventually studio or IP participation. Management reports bidding for USD 4 million to USD 7 million projects compared with earlier typical ticket sizes of USD 1.5 million to USD 2 million.
Commercial Services & Supplies
Diversified Commercial Services
370 Cr
Moderate Risk
9.7
19.5
1.5
1.0
364.00
137.60
Sales CAGR
Profit CAGR
ROE
ROCE
Discovery themes featuring this stock
| Symbol | Watchlist | Price | Market Cap | P/E | P/B | Div Yield (%) | ROE (%) | ROCE (%) | ROA (%) |
44.08 | 432 Cr | 30.96 | 1.90 | 0.00 | 6.43 | 8.77 | 1.59 | ||
376.60 | 392 Cr | 9.73 | 0.58 | 15.93 | 3.17 | 4.19 | 5.62 | ||
146.50 | 370 Cr | 9.68 | 1.03 | 0.00 | 10.23 | 13.23 | 6.87 | ||
33.81 | 361 Cr | 16.53 | 1.38 | 7.39 | 9.99 | 7.86 | 4.38 | ||
— | 324 Cr | 169.48 | 6.41 | 0.00 | 3.79 | 3.79 | 2.91 | ||
3.45 | 315 Cr | 5.70 | 1.26 | 3.86 | 22.16 | 27.89 | 16.40 | ||
291.40 | 297 Cr | 29.57 | 3.30 | 0.00 | 12.96 | 16.06 | 9.35 | ||
| Median: 7 Co. | — | 95.29 | 361 Cr | 16.53 | 1.38 | 0.00 | 9.99 | 8.77 | 5.62 |
Bearish
5
Neutral
3
Bullish
6
Bearish
37
Neutral
3
Bullish
6
Bearish
32
Neutral
0
Bullish
0
Bearish
32
Neutral
0
Bullish
0
Bearish
32
Neutral
0
Bullish
0
Bearish
32
Neutral
0
Bullish
0
View Standalone
View Standalone
View Standalone
View Standalone
View Standalone
View Standalone
View Standalone
View Standalone
Basilic Fly Studio Ltd (BASILIC) is currently trading at 146.00 per share. Stock prices fluctuate during market hours on NSE and BSE based on demand, company updates, and overall market conditions. Refer to the live price chart above for the most recent price movement.
Basilic Fly Studio is a Chennai-headquartered visual-effects studio delivering 2D and 3D VFX services, including compositing, rotoscopy, tracking, computer graphics, previsualization, onset supervision and animation support for Indian and international film and streaming productions. The company delivered 81 projects for 52 global clients during Q2 FY27, including marquee titles connected with Netflix, Disney+, Lucasfilm, Warner Bros., Apple TV+ and Sun Network. This unusually broad client mix demonstrates that Basilic is moving beyond a domestic service-provider profile toward a diversified international production platform. Consolidated Q2 revenue increased 13% year-on-year to Rs. 107 crores, while H1 revenue grew 11% to Rs. 211 crores. However, consolidated EBITDA margin declined to 21% in Q2 and 17.5% in H1 because overseas business expanded faster than the higher-margin Indian segment, creating a near-term profitability trade-off. Basilic is investing heavily ahead of anticipated scale, including approximately Rs. 22 crores in AI and technology assets, a five-petabyte server platform, hybrid infrastructure and a Bengaluru studio. These investments have increased depreciation and working-capital requirements before their expected benefits are fully reflected in earnings. The strategic direction is shifting toward larger-ticket international projects, greater Indian offshoring, proprietary editable AI tools and eventually studio or IP participation. Management reports bidding for USD 4 million to USD 7 million projects compared with earlier typical ticket sizes of USD 1.5 million to USD 2 million.
Over the past 52 weeks, Basilic Fly Studio Ltd has traded between a low of ₹137.60 and a high of ₹364.00. The 52-week high and low indicate the stock’s price range over the last year and help investors understand its volatility and recent trading levels.
Basilic Fly Studio Ltd has a market capitalization of approximately 370.13. Market capitalization represents the total value of a company’s outstanding shares and helps investors understand its size, stability, and relative risk compared to other listed companies.
Basilic Fly Studio Ltd’s investment profile depends on its business fundamentals, valuation, and long-term outlook. The stock currently trades at a PE ratio of 9.68 and operates in the its sector sector. Investors typically assess financial performance, growth prospects, and individual risk tolerance before making investment decisions.
Based on its market capitalization of 370.13 Cr, Basilic Fly Studio Ltd is classified as a Small Cap stock. Large-cap stocks are generally more stable, while mid-cap and small-cap stocks tend to offer higher growth potential along with higher price volatility.
Basilic Fly Studio Ltd operates in the its sector sector. Sector classification matters because companies in the same sector are often affected by similar economic conditions, regulatory changes, and competitive dynamics, which can influence overall stock performance.
The Price-to-Earnings (PE) ratio of Basilic Fly Studio Ltd is 9.68. The PE ratio compares a company’s share price to its earnings and is commonly used to assess valuation. Comparing the PE ratio with sector peers and historical levels provides better context.
Basilic said it expects employee costs to decline by close to 4% to 5% over time. Management did not set a financial-year deadline, but linked the outcome to the Bengaluru ramp-up over the next six to eight months and wider offshore delivery.
Basilic said standalone PAT margin declined to 20% from about 30% to 31% because depreciation and amortisation rose on capitalised technology assets. Management said standalone EBITDA margin was 48.5%, compared with 49.5% a year earlier, indicating that the movement before D&A was narrower.
Basilic Fly Studio reported consolidated revenue of ₹107.4 crore in Q2 FY27, up 12.8% year-on-year. Net profit was ₹7.3 crore, down 49.7% year-on-year, with the PAT margin falling to 7% from 15%.
Basilic Fly acquired a majority stake in One of Us in August 2024. The presentation says the transaction strengthened creative leadership, added a premium client portfolio and expanded direct access to UK and European markets.