






Earnings Call/Transcript
Control Print Q2 FY27 Earnings Call Transcript
Control Print filed the transcript of its Q2 FY27 earnings conference call held on October 29, 2026, at 2:00 PM IST.





Welcome to Multibagg AI
Log in to access personalized features
IRIS
Multibagg AI is an AI powered stock research and analysis platform. We provide data, information, content, and analytics for publicly traded Indian companies listed on NSE and BSE. AI can make mistakes, check important information.
Prices might be delayed by a few minutes.
Join our Exclusive Community


Join our Exclusive Community
Made with 💙 in India. © Finsky Technologies Pvt Ltd. 2026


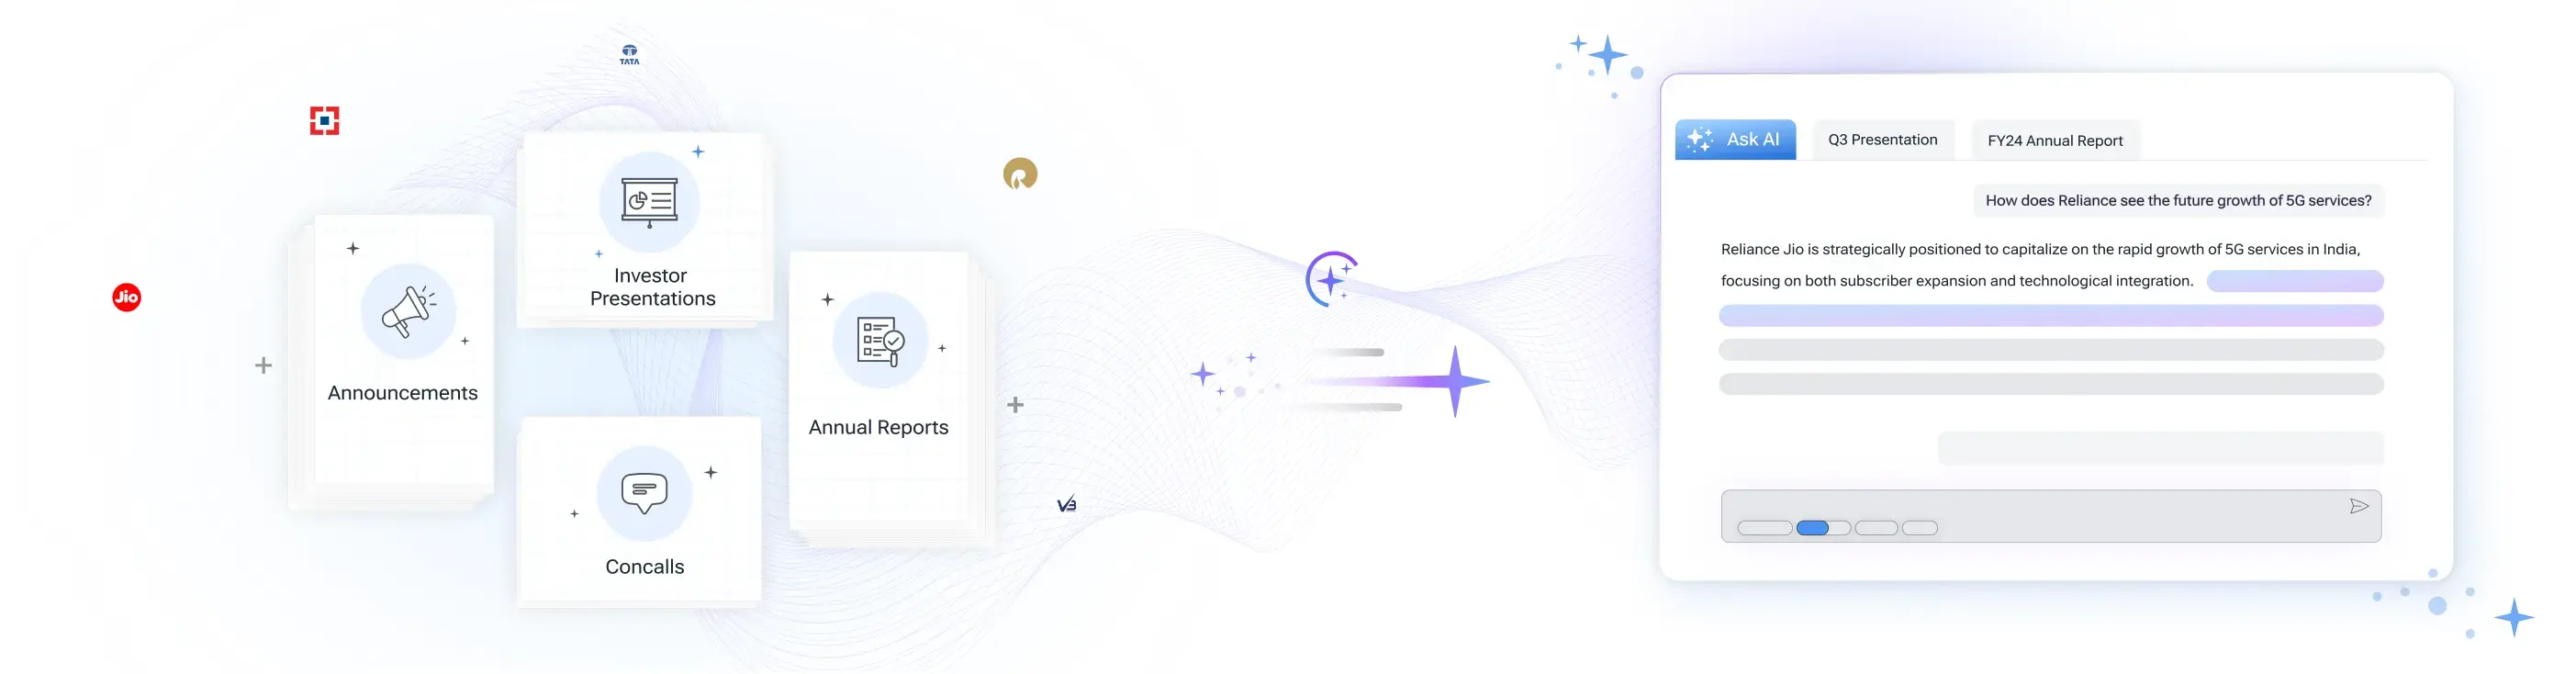
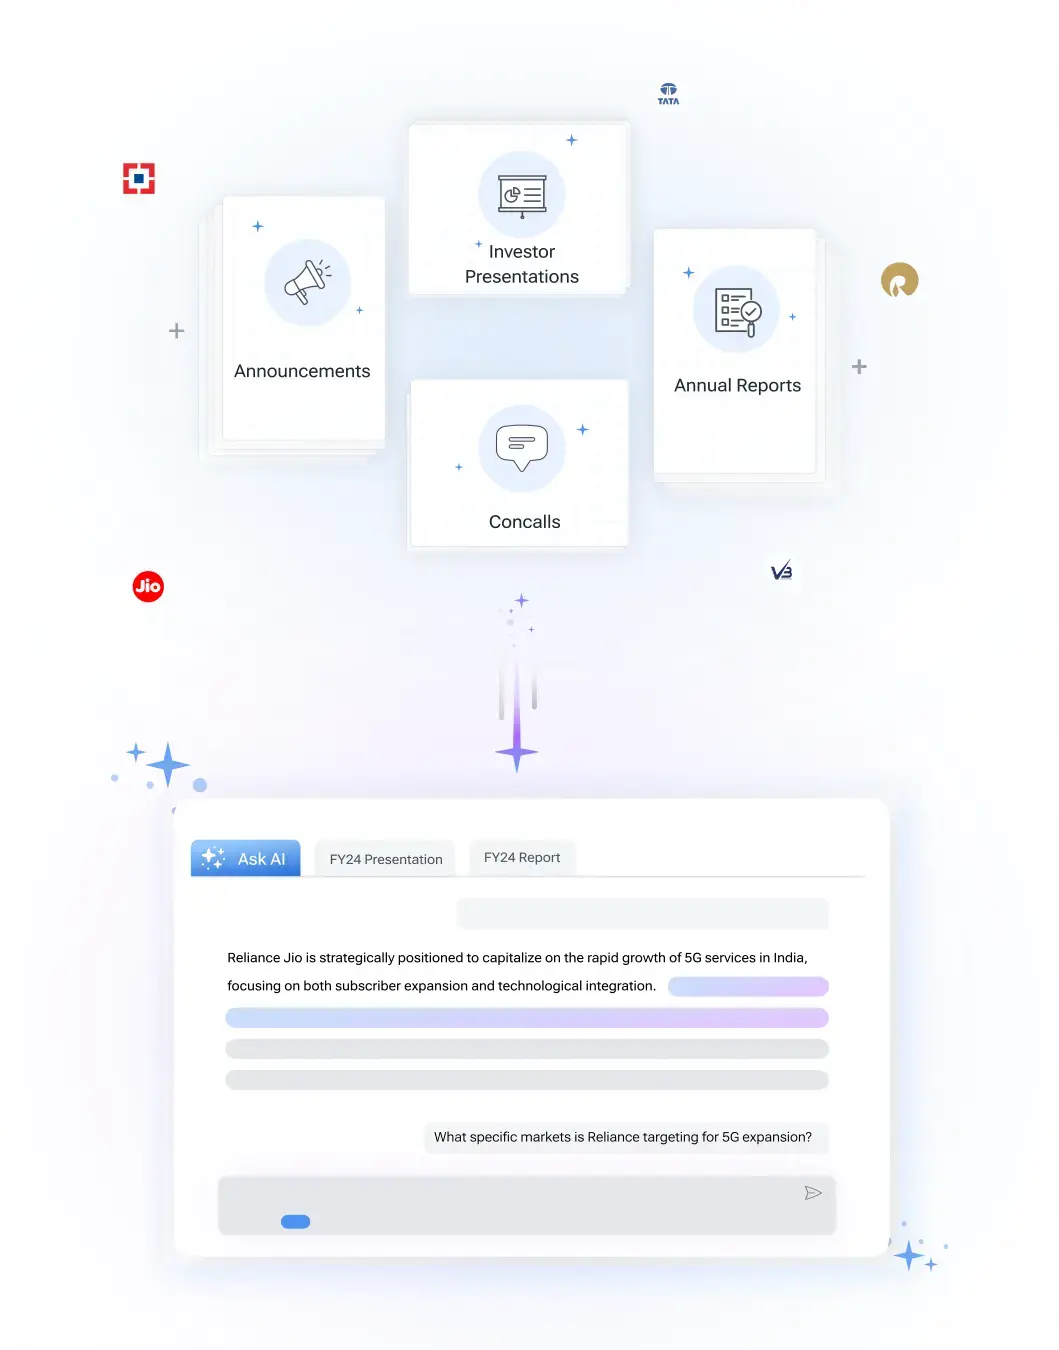
Get instant AI-powered insights about company performance, financials, and strategy. Ask questions about trends, competition, and developments while receiving responses backed by official documents and market data, with clear attribution to source documents.

 Discovery themes featuring this stock
Bearish
4
Neutral
6
Bullish
4
Bearish
18
Neutral
6
Bullish
22
Bearish
14
Neutral
0
Bullish
18
Bearish
14
Neutral
0
Bullish
18
Bearish
14
Neutral
0
Bullish
18
Bearish
14
Neutral
0
Bullish
18
View Standalone
View Standalone
View Standalone
View Standalone
View Standalone
View Standalone
View Standalone
View Standalone
Discovery themes featuring this stock
Earnings Call/Transcript
Control Print filed the transcript of its Q2 FY27 earnings conference call held on October 29, 2026, at 2:00 PM IST.
Financial Results
Control Print published unaudited standalone and consolidated financial results for the quarter and half year ended September 30, 2026, in Business Standard and Navshakti.
Earnings Call/Transcript
Control Print uploaded the audio recording of its Q2 FY2027 analyst and investor conference call held on October 29, 2026, at 2:00 p.m. IST.
Control Print Ltd (CONTROLPR) is currently trading at 591.45 per share. Stock prices fluctuate during market hours on NSE and BSE based on demand, company updates, and overall market conditions. Refer to the live price chart above for the most recent price movement.
Control Print Limited manufactures and services coding-and-marking equipment, printers, inks, cartridges, consumables, spare parts, and maintenance solutions for industrial customers. Its portfolio also includes Track & Trace, anti-counterfeiting software, international coding operations, and V-Shapes packaging technology, serving sectors such as pipes, food, dairy, cable, wire, FMCG, steel, wood, cement, plywood, and sugar. The core coding-and-marking business remains the economic anchor, contributing approximately 94%–95% of operating revenue and benefiting from an oligopolistic domestic market. Control Print Limited and three other players reportedly control around 80% of India’s coding-and-marking market, giving the company meaningful customer access, recurring consumables revenue, and service-based operating leverage. Control Print Limited reported standalone operating revenue of approximately INR 131 crore in Q2 FY27 and INR 235 crore for H1 FY27, compared with INR 100 crore and INR 202 crore respectively in the prior-year periods. Consolidated Q2 operating revenue rose to approximately INR 144 crore from INR 112 crore, although higher consolidated costs continue to reflect overseas and technology investments. Management is pursuing a deliberate portfolio transition: defending the mature core while building international operations, Track & Trace, and packaging as future growth engines. This strategy creates meaningful upside if the pilots and technology platforms succeed, but also explains continuing subsidiary losses, delayed V-Shapes breakeven, and investor concern over capital allocation and execution timelines. Track & Trace could receive structural support from expanding Indian pharmaceutical mandates. Existing requirements cover approximately 300 brands, while future phases are expected to extend coverage toward the top 1,000 brands and additional anti-infective, vaccine, psychotropic, and narcotic products during 2027–2028, subject to final implementation timelines and regulatory execution.
Over the past 52 weeks, Control Print Ltd has traded between a low of ₹517.50 and a high of ₹786.45. The 52-week high and low indicate the stock’s price range over the last year and help investors understand its volatility and recent trading levels.
Control Print Ltd has a market capitalization of approximately 949.58. Market capitalization represents the total value of a company’s outstanding shares and helps investors understand its size, stability, and relative risk compared to other listed companies.
Control Print Ltd’s investment profile depends on its business fundamentals, valuation, and long-term outlook. The stock currently trades at a PE ratio of 28.35 and operates in the its sector sector. Investors typically assess financial performance, growth prospects, and individual risk tolerance before making investment decisions.
Based on its market capitalization of 949.58 Cr, Control Print Ltd is classified as a Small Cap stock. Large-cap stocks are generally more stable, while mid-cap and small-cap stocks tend to offer higher growth potential along with higher price volatility.
Control Print Ltd operates in the its sector sector. Sector classification matters because companies in the same sector are often affected by similar economic conditions, regulatory changes, and competitive dynamics, which can influence overall stock performance.
The Price-to-Earnings (PE) ratio of Control Print Ltd is 28.35. The PE ratio compares a company’s share price to its earnings and is commonly used to assess valuation. Comparing the PE ratio with sector peers and historical levels provides better context.
Control Print said it currently does about Rs 20 crore of Track & Trace business. Management placed that activity within a present market it estimates at Rs 600 crore to Rs 700 crore, including the mandated 300 brands and certain other SKUs.
Control Print said V-Shapes has reduced its original cost base by about 25%. Management said that reduction is one reason losses have been declining, but it did not disclose the original cost base, savings amount or absolute loss figure on the October 29, 2026 call.
Control Print reported standalone operating revenue of Rs 131 crore in Q2 FY27. That was approximately Rs 31 crore above the approximately Rs 100 crore reported in Q2 FY26.
Control Print began its Middle East operation in January 2025. Management said the unit is still building up but has an order pipeline expected to be executed during FY27.
| Symbol | Watchlist | Price | Market Cap | P/E | P/B | Div Yield (%) | ROE (%) | ROCE (%) | ROA (%) |
659.45 | 1,056 Cr | 39.38 | 9.02 | 0.00 | 21.70 | 25.45 | 10.23 | ||
189.45 | 1,037 Cr | 10.00 | 1.83 | 0.00 | 17.30 | 22.09 | 7.20 | ||
593.70 | 950 Cr | 28.35 | 2.06 | 1.68 | 7.12 | 15.05 | 5.53 | ||
79.14 | 801 Cr | -304.70 | 4.21 | 0.00 | -0.06 | -0.04 | -0.53 | ||
287.60 | 700 Cr | 83.02 | 13.31 | 0.00 | 12.70 | 14.29 | 9.64 | ||
366.30 | 683 Cr | -377.44 | 7.12 | 0.00 | 1.25 | 5.45 | -0.64 | ||
332.10 | 545 Cr | 4.35 | 5.05 | 0.30 | 19.78 | 18.75 | 5.85 | ||
| Median: 7 Co. | — | 332.10 | 801 Cr | 10.00 | 5.05 | 0.00 | 12.70 | 15.05 | 5.85 |


Control Print Limited manufactures and services coding-and-marking equipment, printers, inks, cartridges, consumables, spare parts, and maintenance solutions for industrial customers. Its portfolio also includes Track & Trace, anti-counterfeiting software, international coding operations, and V-Shapes packaging technology, serving sectors such as pipes, food, dairy, cable, wire, FMCG, steel, wood, cement, plywood, and sugar.
The core coding-and-marking business remains the economic anchor, contributing approximately 94%–95% of operating revenue and benefiting from an oligopolistic domestic market. Control Print Limited and three other players reportedly control around 80% of India’s coding-and-marking market, giving the company meaningful customer access, recurring consumables revenue, and service-based operating leverage.
Control Print Limited reported standalone operating revenue of approximately INR 131 crore in Q2 FY27 and INR 235 crore for H1 FY27, compared with INR 100 crore and INR 202 crore respectively in the prior-year periods. Consolidated Q2 operating revenue rose to approximately INR 144 crore from INR 112 crore, although higher consolidated costs continue to reflect overseas and technology investments.
Management is pursuing a deliberate portfolio transition: defending the mature core while building international operations, Track & Trace, and packaging as future growth engines. This strategy creates meaningful upside if the pilots and technology platforms succeed, but also explains continuing subsidiary losses, delayed V-Shapes breakeven, and investor concern over capital allocation and execution timelines.
Track & Trace could receive structural support from expanding Indian pharmaceutical mandates. Existing requirements cover approximately 300 brands, while future phases are expected to extend coverage toward the top 1,000 brands and additional anti-infective, vaccine, psychotropic, and narcotic products during 2027–2028, subject to final implementation timelines and regulatory execution.
IT - Hardware
Computers Hardware & Equipments
946 Cr
Moderate Risk
28.2
25.7
0.2
2.1
786.45
517.50
Sales CAGR
Profit CAGR
ROE
ROCE


