




Financial Results
Tarsons Products Publishes September 2026 Results
Tarsons Products published unaudited standalone and consolidated financial results for the quarter and half year ended September 30, 2026, in Financial Express and Aajkaal.





IRIS
Multibagg AI is an AI powered stock research and analysis platform. We provide data, information, content, and analytics for publicly traded Indian companies listed on NSE and BSE. AI can make mistakes, check important information.
Prices might be delayed by a few minutes.
Join our Exclusive Community


Join our Exclusive Community
Made with 💙 in India. © Finsky Technologies Pvt Ltd. 2026


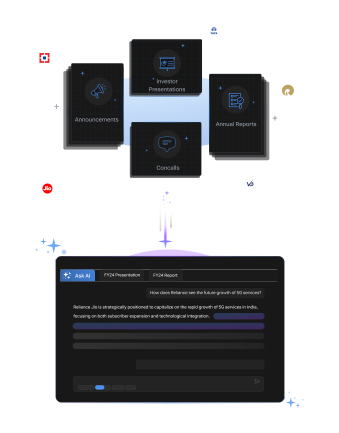
Get instant AI-powered insights about company performance, financials, and strategy. Ask questions about trends, competition, and developments while receiving responses backed by official documents and market data, with clear attribution to source documents.




 Discovery themes featuring this stockDiscovery themes featuring this stock
| Symbol | Watchlist | Price | Market Cap | P/E | P/B | Div Yield (%) | ROE (%) | ROCE (%) | ROA (%) |
23.93 | 1,672 Cr | 100.06 | 3.59 | 0.02 | 8.06 | 10.61 | 3.65 | ||
309.45 | 1,646 Cr | 221.30 | 2.60 | 0.00 | 1.17 | 3.38 | 0.63 | ||
199.20 | 1,096 Cr | 35.79 | 4.14 | 0.00 | 13.70 | 14.55 | 9.68 | ||
439.65 | 1,026 Cr | 18.99 | 2.10 | 0.00 | 11.22 | 15.16 | 7.83 | ||
642.50 | 934 Cr | 29.59 | 5.96 | 0.00 | 13.22 | 14.71 | 11.51 | ||
480.85 | 841 Cr | 71.05 | 4.42 | 0.00 | 6.32 | 8.26 | 5.38 | ||
368.85 | 656 Cr | 20.44 | 3.23 | 0.00 | 14.31 | 18.03 | 9.00 | ||
| Median: 7 Co. | — | 368.85 | 1,026 Cr | 35.79 | 3.59 | 0.00 | 11.22 | 14.55 | 7.83 |
Bearish
2
Neutral
7
Bullish
5
Bearish
25
Neutral
7
Bullish
14
Bearish
23
Neutral
0
Bullish
9
Bearish
23
Neutral
0
Bullish
9
Bearish
23
Neutral
0
Bullish
9
Bearish
23
Neutral
0
Bullish
9


Tarsons Products Limited designs, manufactures, and markets laboratory consumables, reusable plasticware, and benchtop instruments used by research institutions, pharmaceutical companies, CROs, diagnostics providers, academia, and hospitals. Its portfolio exceeds 2,000 SKUs across 350 product segments, supported by six vertically integrated facilities, pan-India distribution, and exports to more than 40 countries.
Consolidated revenue rose 21% year-on-year in both Q2 and H1 FY27, reaching ₹123.7 crore and ₹233.9 crore respectively. Export growth was particularly strong at 37% in Q2 and 33% in H1, indicating recovery across international markets and increasing traction for Tarsons’ branded and ODM offerings.
Profitability is under near-term pressure despite strong revenue growth. Consolidated H1 EBITDA increased 9% to ₹57.1 crore, but EBITDA margin declined to 24.4% from 26.9%, while PAT turned negative because of raw-material inflation, accelerated depreciation, higher finance costs, and acquisition-related consolidation adjustments.
The company is investing ahead of demand through the Amta and Panchla facilities, with Amta fully operational and Panchla progressively commencing production. Cell-culture capacity is expected to become operational in H2 FY27, creating a new product category and potentially broadening Tarsons’ addressable market beyond its established labware portfolio.
Tarsons combines a recognized domestic brand, automated clean-room manufacturing, and a broad distributor network with an international expansion strategy. Its longer-term thesis depends on converting capacity additions, cell-culture products, export recovery, and operating leverage into higher utilization and margin recovery over the next three to five years.
Healthcare Equipment & Supplies
Medical Equipment & Supplies
1,646 Cr
Moderate Risk
221.3
60.1
1.2
2.6
374.40
164.15
Sales CAGR
Profit CAGR
ROE
ROCE
View Standalone
View Standalone
View Standalone
View Standalone
View Standalone
View Standalone
View Standalone
View Standalone

Financial Results
Tarsons Products published unaudited standalone and consolidated financial results for the quarter and half year ended September 30, 2026, in Financial Express and Aajkaal.
Earnings Call/Transcript
Tarsons Products uploaded the audio recording of its November 13, 2026 conference call on financial performance and unaudited Q2 FY27 results.
Investor Presentation
Tarsons Products Ltd shared its investor presentation for Q2 and H1 FY27, reporting 21% consolidated revenue growth but negative consolidated PAT due to higher costs and depreciation.
Other
Tarsons Products will attend group and one-on-one analyst and institutional investor meetings in Mumbai on November 18, 2026.
Financial Results
Tarsons Products approved unaudited standalone and consolidated financial results for the quarter and half-year ended September 30, 2026, along with the statutory auditors’ limited review report.
Tarsons Products Ltd (TARSONS) is currently trading at 309.10 per share. Stock prices fluctuate during market hours on NSE and BSE based on demand, company updates, and overall market conditions. Refer to the live price chart above for the most recent price movement.
Tarsons Products Limited designs, manufactures, and markets laboratory consumables, reusable plasticware, and benchtop instruments used by research institutions, pharmaceutical companies, CROs, diagnostics providers, academia, and hospitals. Its portfolio exceeds 2,000 SKUs across 350 product segments, supported by six vertically integrated facilities, pan-India distribution, and exports to more than 40 countries. Consolidated revenue rose 21% year-on-year in both Q2 and H1 FY27, reaching ₹123.7 crore and ₹233.9 crore respectively. Export growth was particularly strong at 37% in Q2 and 33% in H1, indicating recovery across international markets and increasing traction for Tarsons’ branded and ODM offerings. Profitability is under near-term pressure despite strong revenue growth. Consolidated H1 EBITDA increased 9% to ₹57.1 crore, but EBITDA margin declined to 24.4% from 26.9%, while PAT turned negative because of raw-material inflation, accelerated depreciation, higher finance costs, and acquisition-related consolidation adjustments. The company is investing ahead of demand through the Amta and Panchla facilities, with Amta fully operational and Panchla progressively commencing production. Cell-culture capacity is expected to become operational in H2 FY27, creating a new product category and potentially broadening Tarsons’ addressable market beyond its established labware portfolio. Tarsons combines a recognized domestic brand, automated clean-room manufacturing, and a broad distributor network with an international expansion strategy. Its longer-term thesis depends on converting capacity additions, cell-culture products, export recovery, and operating leverage into higher utilization and margin recovery over the next three to five years.
Over the past 52 weeks, Tarsons Products Ltd has traded between a low of ₹164.15 and a high of ₹374.40. The 52-week high and low indicate the stock’s price range over the last year and help investors understand its volatility and recent trading levels.
Tarsons Products Ltd has a market capitalization of approximately 1,646.47. Market capitalization represents the total value of a company’s outstanding shares and helps investors understand its size, stability, and relative risk compared to other listed companies.
Tarsons Products Ltd’s investment profile depends on its business fundamentals, valuation, and long-term outlook. The stock currently trades at a PE ratio of 221.30 and operates in the its sector sector. Investors typically assess financial performance, growth prospects, and individual risk tolerance before making investment decisions.
Based on its market capitalization of 1,646.47 Cr, Tarsons Products Ltd is classified as a Small Cap stock. Large-cap stocks are generally more stable, while mid-cap and small-cap stocks tend to offer higher growth potential along with higher price volatility.
Tarsons Products Ltd operates in the its sector sector. Sector classification matters because companies in the same sector are often affected by similar economic conditions, regulatory changes, and competitive dynamics, which can influence overall stock performance.
The Price-to-Earnings (PE) ratio of Tarsons Products Ltd is 221.30. The PE ratio compares a company’s share price to its earnings and is commonly used to assess valuation. Comparing the PE ratio with sector peers and historical levels provides better context.
Tarsons reported a Rs 1.8 crore consolidated loss after tax in H1 FY27 as depreciation increased to Rs 55.3 crore and finance cost rose to Rs 12.9 crore. The company also reported lower gross margin following higher raw-material prices, changes in product mix and costs related to newly commissioned facilities.
Tarsons says revenue from its new Amta capacity commenced in Q4 FY26. The site includes a fulfilment centre, in-house sterilisation and manufacturing capability, and contributed 1.0% of FY26 manufacturing revenue.
Tarsons Products reported a consolidated net loss of ₹0.34 crore for the quarter ended September 30, 2026. It had reported a consolidated profit of ₹3.32 crore in the corresponding quarter of Q2 FY26.
Consolidated revenue for Q1 FY27 was ₹110.24 crore, up from ₹91.36 crore in Q1 FY26.