Actions
Action Type





IRIS
Multibagg AI is an AI powered stock research and analysis platform. We provide data, information, content, and analytics for publicly traded Indian companies listed on NSE and BSE. AI can make mistakes, check important information.
Prices might be delayed by a few minutes.
Join our Exclusive Community


Join our Exclusive Community
Made with 💙 in India. © Finsky Technologies Pvt Ltd. 2026


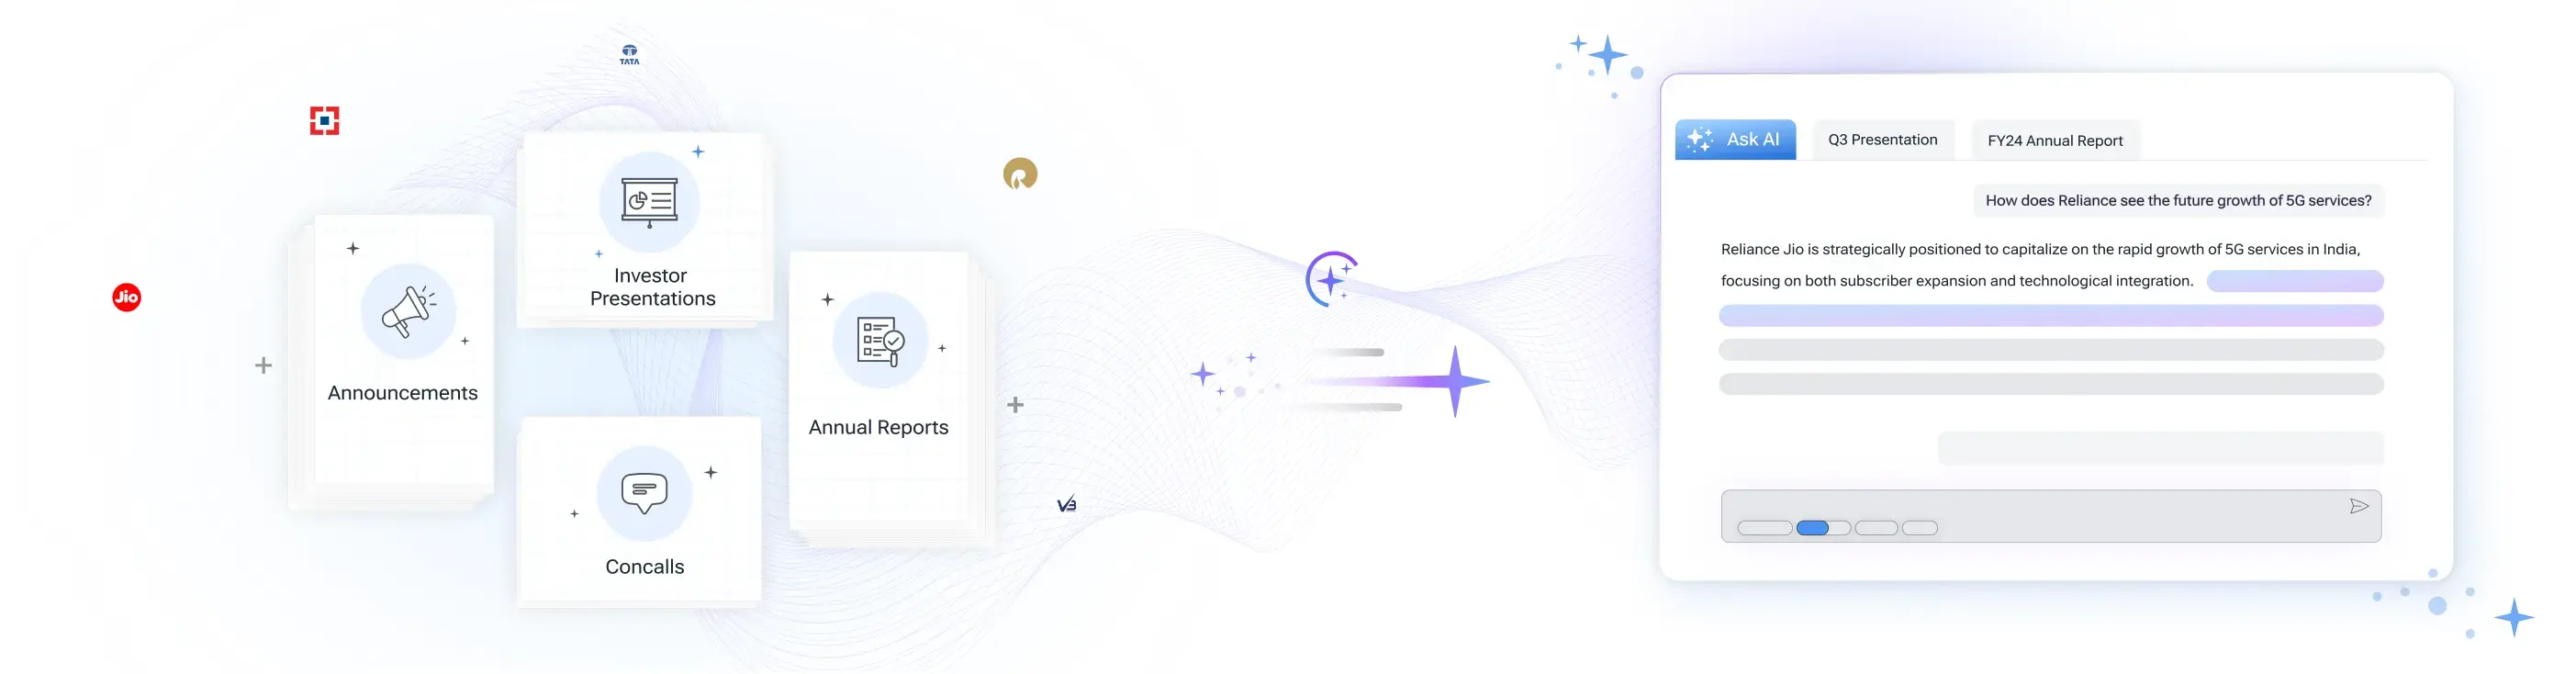
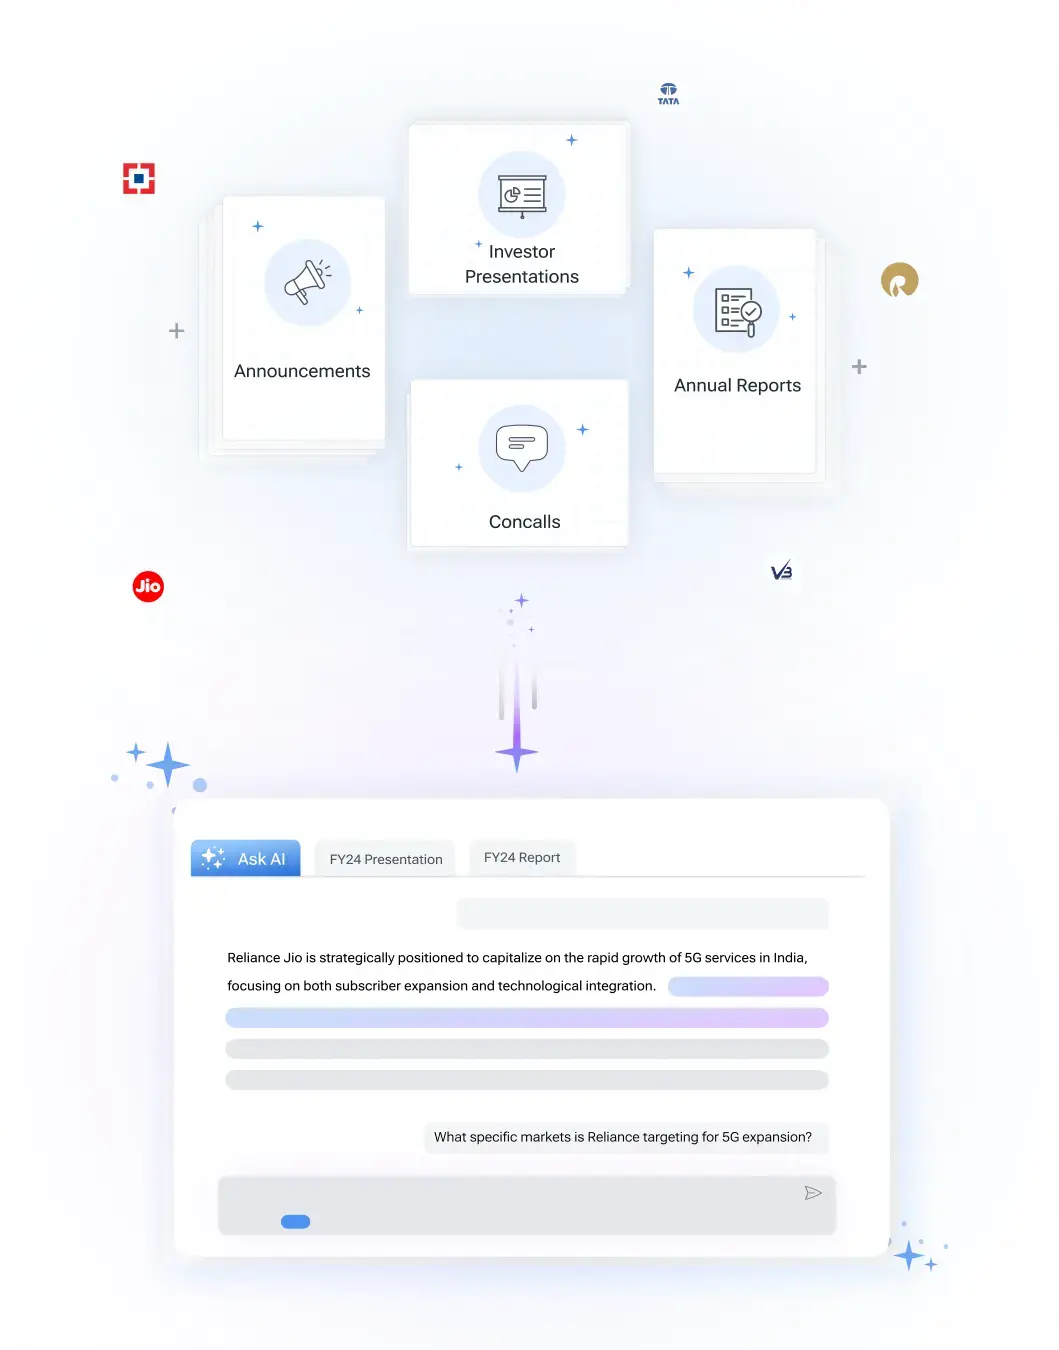
Get instant AI-powered insights about company performance, financials, and strategy. Ask questions about trends, competition, and developments while receiving responses backed by official documents and market data, with clear attribution to source documents.

 Discovery themes featuring this stock




Vasa Denticity Limited operates Dentalkart.com, a digital B2B marketplace distributing dental consumables, instruments, equipment and accessories to clinics, hospitals and dental professionals across India. Its platform combines a website, mobile application, owned dental brands, centralized and regional inventory, logistics partnerships, digital dentistry products, and an emerging dental laboratory services business.
The company delivered 19.4% year-on-year revenue growth to ₹87.1 crore in the quarter, while operating EBITDA increased 23.9% to ₹7.24 crore. This improvement occurred despite gross margins being nearly six percentage points lower, because operating expenses fell structurally from 25.2% to 18.9% of revenue through automation and operating leverage.
Vasa Denticity Limited has historically served 3.1 lakh dentists, while approximately 50,000 customers currently purchase monthly and 1.44 lakh purchased during the previous financial year. Management believes the principal growth opportunity is not immediate customer acquisition, but increasing retention and wallet share from existing dentists, who currently contribute only 10–15% of their potential clinic spending.
Inventory rose to ₹104 crore to reduce stockouts, support new product launches, satisfy supplier minimum-order quantities and serve five warehouses. This reduced stockouts among the top 2,500 SKUs from 33% to 8.8%, but it also tied up operating cash; management expects second-half sell-through to convert the inventory investment back into cash.
The company is expanding beyond product distribution into InstaDent’s rapid-delivery network, digital dentistry and Smileworks laboratory services. InstaDent has grown from approximately 18–20 weekly orders to around 200, contributing about 8% of channel sales, while the digital division contributes close to 5% of total revenue and Smileworks became EBITDA-positive in the latest quarter.
Healthcare Equipment & Supplies
Medical Equipment & Supplies
841 Cr
Low Risk
71.1
60.5
5.7
4.4
612.00
322.50
Sales CAGR
Profit CAGR
ROE
ROCE
Discovery themes featuring this stock
| Symbol | Watchlist | Price | Market Cap | P/E | P/B | Div Yield (%) | ROE (%) | ROCE (%) | ROA (%) |
199.20 | 1,096 Cr | 35.79 | 4.14 | 0.00 | 13.70 | 14.55 | 9.68 | ||
439.65 | 1,026 Cr | 18.99 | 2.10 | 0.00 | 11.22 | 15.16 | 7.83 | ||
642.50 | 934 Cr | 29.59 | 5.96 | 0.00 | 13.22 | 14.71 | 11.51 | ||
480.85 | 841 Cr | 71.05 | 4.42 | 0.00 | 6.32 | 8.26 | 5.38 | ||
368.85 | 656 Cr | 20.44 | 3.23 | 0.00 | 14.31 | 18.03 | 9.00 | ||
136.60 | 607 Cr | 17.05 | 1.38 | 0.00 | 6.78 | 9.14 | 5.19 | ||
382.50 | 459 Cr | 20.34 | 3.36 | 0.26 | 16.50 | 22.08 | 15.33 | ||
| Median: 7 Co. | — | 382.50 | 841 Cr | 20.44 | 3.36 | 0.00 | 13.22 | 14.71 | 9.00 |
View Standalone
View Standalone
View Standalone
View Standalone
View Standalone
View Standalone
View Standalone
View Standalone
Bearish
8
Neutral
2
Bullish
4
Bearish
9
Neutral
2
Bullish
35
Bearish
1
Neutral
0
Bullish
31
Bearish
1
Neutral
0
Bullish
31
Bearish
1
Neutral
0
Bullish
31
Bearish
1
Neutral
0
Bullish
31


Vasa Denticity Ltd (DENTALKART) is currently trading at 477.00 per share. Stock prices fluctuate during market hours on NSE and BSE based on demand, company updates, and overall market conditions. Refer to the live price chart above for the most recent price movement.
Vasa Denticity Limited operates Dentalkart.com, a digital B2B marketplace distributing dental consumables, instruments, equipment and accessories to clinics, hospitals and dental professionals across India. Its platform combines a website, mobile application, owned dental brands, centralized and regional inventory, logistics partnerships, digital dentistry products, and an emerging dental laboratory services business. The company delivered 19.4% year-on-year revenue growth to ₹87.1 crore in the quarter, while operating EBITDA increased 23.9% to ₹7.24 crore. This improvement occurred despite gross margins being nearly six percentage points lower, because operating expenses fell structurally from 25.2% to 18.9% of revenue through automation and operating leverage. Vasa Denticity Limited has historically served 3.1 lakh dentists, while approximately 50,000 customers currently purchase monthly and 1.44 lakh purchased during the previous financial year. Management believes the principal growth opportunity is not immediate customer acquisition, but increasing retention and wallet share from existing dentists, who currently contribute only 10–15% of their potential clinic spending. Inventory rose to ₹104 crore to reduce stockouts, support new product launches, satisfy supplier minimum-order quantities and serve five warehouses. This reduced stockouts among the top 2,500 SKUs from 33% to 8.8%, but it also tied up operating cash; management expects second-half sell-through to convert the inventory investment back into cash. The company is expanding beyond product distribution into InstaDent’s rapid-delivery network, digital dentistry and Smileworks laboratory services. InstaDent has grown from approximately 18–20 weekly orders to around 200, contributing about 8% of channel sales, while the digital division contributes close to 5% of total revenue and Smileworks became EBITDA-positive in the latest quarter.
Over the past 52 weeks, Vasa Denticity Ltd has traded between a low of ₹322.50 and a high of ₹612.00. The 52-week high and low indicate the stock’s price range over the last year and help investors understand its volatility and recent trading levels.
Vasa Denticity Ltd has a market capitalization of approximately 841.18. Market capitalization represents the total value of a company’s outstanding shares and helps investors understand its size, stability, and relative risk compared to other listed companies.
Vasa Denticity Ltd’s investment profile depends on its business fundamentals, valuation, and long-term outlook. The stock currently trades at a PE ratio of 71.05 and operates in the its sector sector. Investors typically assess financial performance, growth prospects, and individual risk tolerance before making investment decisions.
Based on its market capitalization of 841.18 Cr, Vasa Denticity Ltd is classified as a Small Cap stock. Large-cap stocks are generally more stable, while mid-cap and small-cap stocks tend to offer higher growth potential along with higher price volatility.
Vasa Denticity Ltd operates in the its sector sector. Sector classification matters because companies in the same sector are often affected by similar economic conditions, regulatory changes, and competitive dynamics, which can influence overall stock performance.
The Price-to-Earnings (PE) ratio of Vasa Denticity Ltd is 71.05. The PE ratio compares a company’s share price to its earnings and is commonly used to assess valuation. Comparing the PE ratio with sector peers and historical levels provides better context.
Vasa Denticity’s management said it sees operating EBITDA compounding into a 13%-18% range over time. The company did not give a deadline for reaching that range and described the outcome as dependent on lower operating costs and improved availability.
Dentalkart says a clinic is not fully digital simply because it owns a scanner. Management’s definition includes the related equipment and workflow around digital dentistry. It estimates that 4% of India’s 2.87 lakh dental clinics meet that broader definition.
Dentalkart includes scanners, 3D printers, milling systems and imaging in digital dentistry. The associated revenue model also covers consumables such as resins, blocks and burs, plus Smileworks Lab crowns and aligners.
Dentalkart shipped 2.00 lakh orders in Q2 FY27, 1.8% fewer than a year earlier. Management said dentists consolidated purchases into fewer, larger orders, while orders per customer fell 6.4% to 2.66.