










Dentalkart says larger baskets lifted Q2 order value 20.5%
Key highlights
- Dentalkart shipped 2.00 lakh orders in Q2 FY27, down 1.8% year on year.
- Dentalkart’s average order value rose 20.5% year on year to ₹4,296 in Q2 FY27.
- Dentalkart reported operating EBITDA per order of ₹353, up 18.8% year on year.
- Dentalkart’s top-2,500-SKU stock-out rate fell to 8.8% from a FY26 peak of 33.0%.
powered by IRIS
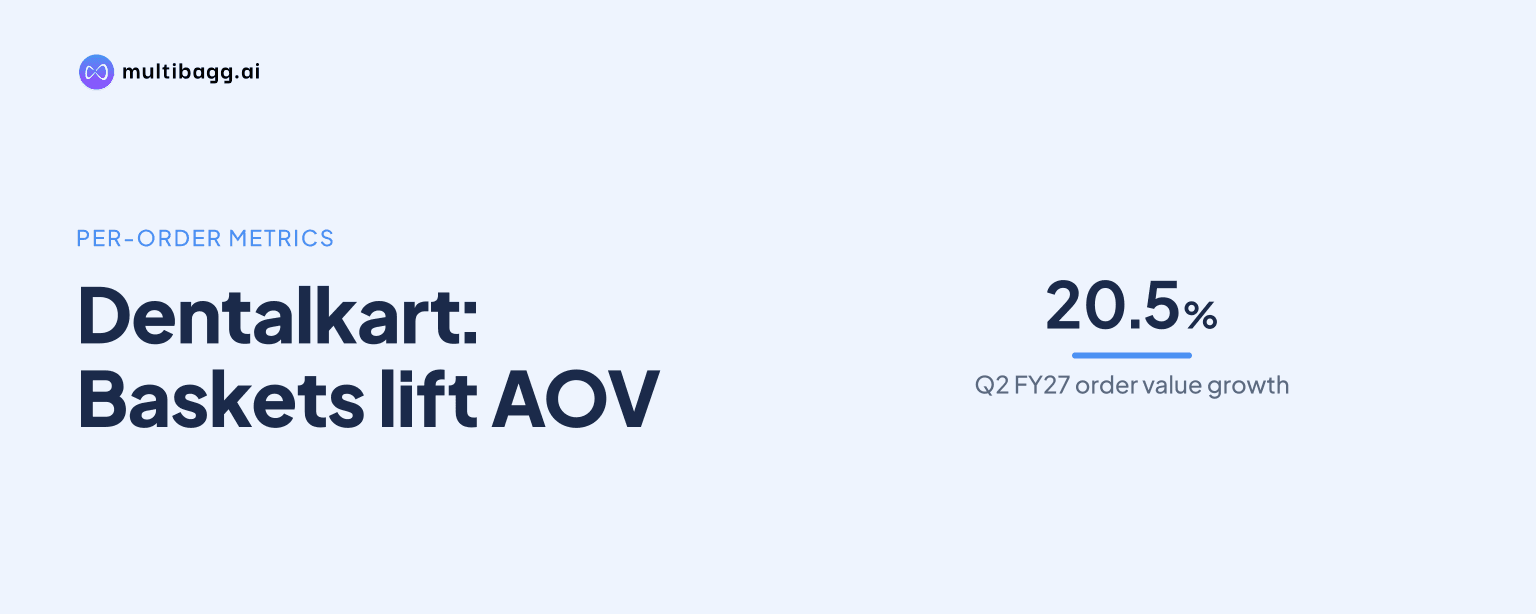
Vasa Dentistry Limited, which operates as Dentalkart, reported Q2 FY27 average order value of ₹4,296, up 20.5% year on year despite orders shipped falling 1.8% to 2.00 lakh. Dentalkart attributed the change to dentists consolidating purchases into fewer, larger orders, while operating EBITDA per order rose 18.8% to ₹353.
Know Vasa Denticity inside out
Results, valuation, peers and who's buying, in one view.
Why did Dentalkart’s order value rise while shipments fell?
Dentalkart says dentists placed fewer, larger orders in Q2 FY27, lifting average order value while reducing the number of parcels shipped. Orders shipped were 2.00 lakh, down 1.8% year on year but up 5.9% from Q1 FY27. Customers served increased 4.9% year on year and 8.8% quarter on quarter to 75,277.
The channel figures show the increase was not limited to overall order value. Online average order value rose 27.6% year on year to ₹3,454, while offline average order value increased 122.7% to ₹97,625. Dentalkart calculates overall average order value as standalone revenue divided by orders, online average order value as online revenue divided by online orders, and offline average order value as business-to-business revenue divided by invoices.
Orders per customer declined 6.4% year on year and 2.6% quarter on quarter to 2.66 in Q2 FY27. Yet revenue per customer increased 12.7% year on year to ₹11,428, although it declined 3.7% from Q1 FY27. The combination indicates higher spending per customer despite lower ordering frequency than a year earlier.
How did larger orders affect Dentalkart’s cost per order?
Dentalkart reported cost per order of ₹804 in Q2 FY27, down 8.2% year on year but up 3.8% from Q1 FY27. Management attributed the quarter-on-quarter increase to about ₹30 lakh of one-off severance expense, higher courier rates and fewer orders over which to spread operating costs. Excluding severance, cost per order was ₹789.
Total operating cost was ₹16.43 crore in Q2 FY27, down 10.5% from ₹18.35 crore in Q2 FY26, while revenue from operations rose to ₹87.10 crore from ₹72.90 crore. Operating cost excluding severance was ₹16.13 crore, down 12.1% year on year. Costs represented 18.9% of revenue, compared with 25.2% a year earlier, a reduction of 629 basis points, where one basis point equals one-hundredth of a percentage point.
Employee costs declined 1.8% year on year to ₹5.86 crore, while other expenses, including warehousing, shipping and marketing, fell 14.6% to ₹10.57 crore. Both lines rose from Q1 FY27, with employee costs up 5.7% and other expenses up 5.8%. Operating EBITDA, or earnings before interest, tax, depreciation and amortisation, per order nevertheless increased 31.7% quarter on quarter to ₹353.
Got a follow-up? Ask IRIS
What did larger baskets mean for Dentalkart’s margins?
Dentalkart reported an operating EBITDA margin of 8.3% in Q2 FY27, compared with 8.0% in Q2 FY26 and 6.1% in Q1 FY27. Gross margin reached 27.2%, up from 24.8% in Q1 FY27 and 23.7% in Q4 FY26. The 27.2% gross margin was within Dentalkart’s stated 25% to 30% operating band.
Management linked the gross-margin recovery to rebuilding own-brand availability after stock-outs in the second half of FY26 moved sales toward lower-margin third-party products. It also said a weaker rupee had added costs in that period. Revenue from operations increased by ₹4.00 crore from ₹83.10 crore in Q1 FY27 to ₹87.10 crore in Q2 FY27, while gross margin rose by 2.4 percentage points.
Dentalkart’s longer-term operating EBITDA margin range is 13% to 18%, although management describes it as a range rather than a forecast and gives no timeline. Management said most potential improvement would come from operating costs falling toward 12% to 15% of revenue. Its stated long-term cost benchmark comprises logistics, people and other costs of about 4% of revenue each.
Can inventory and service levels support Dentalkart’s larger baskets?
Dentalkart increased inventory to ₹104.09 crore at 30 September 2026 from ₹81.16 crore at 31 March 2026, as it sought to prevent renewed stock-outs. Inventory days increased to about 151 from about 137. The company calculates inventory days as inventory divided by half-year cost of goods multiplied by days.
Management cited stock-out protection, supplier minimum order quantities and catalogue breadth as reasons for the increase. A newly Central Drugs Standard Control Organisation licensed product can carry a supplier minimum order quantity that takes about six months to sell, according to Dentalkart. The presentation also cited root-canal files available from size 6 to 140, compared with local dealers that it said may stop at about size 30.
Service measures improved as inventory increased. The stock-out rate for Dentalkart’s top 2,500 revenue stock-keeping units, or SKUs, was 8.8% as at 6 November 2026, down from a FY26 peak of 33.0% and 12.9% in Q1 FY27. On-time delivery rose to 93.6% in Q2 FY27 from 92.9% in Q1 FY27, while average delivery time held at about 4.2 days, compared with 4.7 days in Q2 FY26.
Conclusion
Dentalkart’s Q2 FY27 figures indicate that larger basket sizes, rather than parcel-volume growth, drove its customer-order economics. Average order value rose 20.5%, revenue per customer increased 12.7% and operating EBITDA per order grew 18.8%, even as shipped orders fell 1.8% and orders per customer declined 6.4%.
The next disclosed milestones are Dentalkart’s target to reduce the top-2,500-SKU stock-out rate below 5% by December 2026 and its working inventory-days path of 120 to 150 in FY27, 90 to 120 in FY28 and below 100 thereafter. Management has said availability will take precedence over inventory cuts, and its 13% to 18% operating EBITDA margin range has no stated timeline.