










Altius distributions reached Rs 23,910 crore as exceptional cash faded
Key highlights
- Altius reported cumulative distributions of Rs 23,910 crore, or Rs 85.7 per unit, through H1 FY27.
- FY26 total distributions were Rs 4,770 crore, down from Rs 5,750 crore in FY25.
- Steady-state operating cash distribution rose to Rs 15.6 per unit in FY26 from Rs 14.2 in FY25.
- No exceptional operating-cash distribution was shown for FY26 or H1 FY27, versus Rs 5.4 per unit in FY25.
powered by IRIS
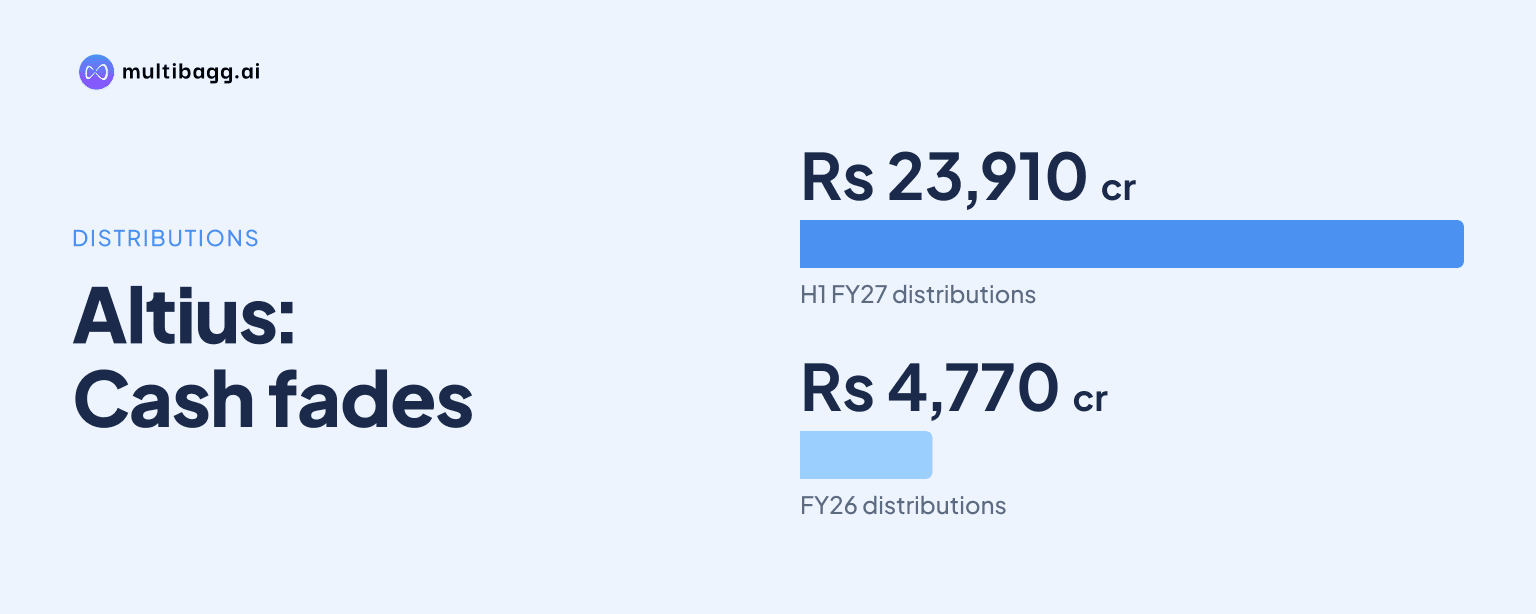
Through H1 FY27, Altius had distributed Rs 23,910 crore, or Rs 85.7 per unit, while its steady-state operating cash distribution reached Rs 15.6 per unit in FY26 and no exceptional operating-cash component was shown for FY26 or H1 FY27. The historical record includes regular operating cash and acquisition-related exceptional distributions.
Know Altius Telecom Infrastructure Trust inside out
Results, valuation, peers and who's buying, in one view.
How much has Altius distributed till date?
Altius has distributed Rs 23,910 crore till date, according to its H1 FY27 presentation, equal to Rs 85.7 per unit. The reported distribution history begins in FY21, when total distributions were Rs 1,030 crore, then rose through FY25 before declining in FY26. Altius also says that more than 94% of its stated NDCF cash-flow measure has been distributed quarterly.
The cumulative total needs to be viewed with its distribution components because Altius separates steady-state operating cash from exceptional operating cash. In FY21 to FY25, exceptional items included distributions connected with purchases of additional Summit towers and the Elevar acquisition. Altius says distribution components, mix and quantum may vary in subsequent periods, so the Rs 85.7 per-unit cumulative amount does not solely represent recurring operations.
How did Altius distributions change from FY25 to FY26?
Altius total distributions fell to Rs 4,770 crore in FY26 from Rs 5,750 crore in FY25, a reduction of Rs 980 crore. Return on capital per unit declined to Rs 10.3 from Rs 14.7, while return of capital per unit increased to Rs 5.3 from Rs 4.9. The lower total payment therefore coincided with a changed split between the two per-unit categories disclosed by Altius.
H1 FY27 distributions were Rs 2,450 crore, including Rs 5.5 per unit classified as return on capital and Rs 2.5 per unit as return of capital. This half-year amount is not directly comparable with the FY26 full-year figure. FY21 also represents seven months of Summit operations, while FY25 includes about seven months of Elevar operations.
Total distributions rose from Rs 1,030 crore in FY21 to Rs 5,750 crore in FY25, before falling by about 17% in FY26. The change followed a period in which FY25 included Rs 5.4 per unit of exceptional operating cash. Altius presents FY26 with a lower overall payout and a different operating-cash mix from the acquisition-influenced periods.
Got a follow-up? Ask IRIS
What was the role of exceptional cash distributions?
Exceptional operating cash distributions were Rs 2.1 per unit in FY21, Rs 1.5 in FY22, Rs 1.9 in FY23, Rs 7.3 in FY24 and Rs 5.4 in FY25. Altius did not show an exceptional operating-cash amount for FY26 or H1 FY27 in its per-unit distribution table. On the presentation’s figures, exceptional cash was most prominent in FY24 and FY25 before no longer appearing as a separately reported component.
Steady-state operating cash distribution increased from Rs 10.7 per unit in FY24 to Rs 14.2 in FY25 and Rs 15.6 in FY26. The FY26 amount was Rs 1.4 per unit higher than FY25 despite the decline in total distributions. H1 FY27 showed Rs 8.0 per unit of steady-state operating cash, which is a half-year amount rather than a full-year figure.
Altius gives a specific qualification for the FY25 presentation. Elevar was acquired on 12 September 2023 with a significant opening cash balance that was distributed. For illustrative presentation, Altius adjusted FY25 distribution components for Elevar cash flows from 1 April to 11 September 2024, net of Altius debt servicing, assuming the debt had been in place from 1 April 2024; this reduced the displayed opening-cash-balance distribution by that amount.
What supports Altius's steady-state operating cash distribution?
Altius reported adjusted revenue of Rs 6,320.8 crore and Cash EBITDA of Rs 4,335.7 crore in H1 FY27, up 3.6% and 5.3% year on year, respectively. Cash EBITDA means earnings before interest, tax, depreciation and amortisation after Ind AS 116 adjustments, including lease-liability payments reflected in financing cash flows and the Revenue Equalization Reserve. These operating measures are not a forecast of future distributions.
The asset base was 258,000 towers at H1 FY27, unchanged from FY26 and up from 257,000 in FY25. The tenancy ratio was 1.2 times in FY25, FY26 and H1 FY27, compared with 1.0 times in FY21 and FY22. This operating history provides context for the Rs 15.6 per-unit steady-state payment in FY26 and Rs 8.0 per unit reported in H1 FY27.
Altius also cites contracted revenue arrangements as a source of cash-flow visibility. It reported a weighted average lease expiry of about 15.4 years, with 45% of tenancy share locked in for up to 10 years and 55% locked in for up to 30 years. More than 80% of total revenue came from tenants carrying AAA ratings from leading Indian rating agencies, according to the presentation.
Conclusion
Altius's Rs 23,910 crore distribution record combines operating cash with acquisition-related exceptional distributions, making the cumulative amount broader than a recurring payout measure. The clearest disclosed change is from Rs 5.4 per unit of exceptional operating cash in FY25 to no separately shown exceptional amount in FY26 or H1 FY27, while steady-state operating cash increased from Rs 14.2 to Rs 15.6 per unit in FY26.
The next distribution update will indicate how the Rs 8.0 per-unit H1 FY27 steady-state amount develops over the full year and how return-of-capital payments evolve after Rs 2.5 per unit in the half year. Altius says that distribution components, mix and quantum may vary in subsequent periods, making the disclosed split between steady-state and exceptional cash the key item to watch.