










Altius reports 55% tenancy in long contracts up to 30 years
Key highlights
- Altius says 55% of tenancy share is locked in for up to 30 years, with 23.9 years remaining.
- Altius reports a weighted average lease expiry of about 15.4 years.
- More than 80% of Altius total revenue comes from tenants with AAA ratings.
- H1 FY27 adjusted revenue rose 3.6% to Rs 6,320.8 crore and cash EBITDA rose 5.3% to Rs 4,335.7 crore.
powered by IRIS
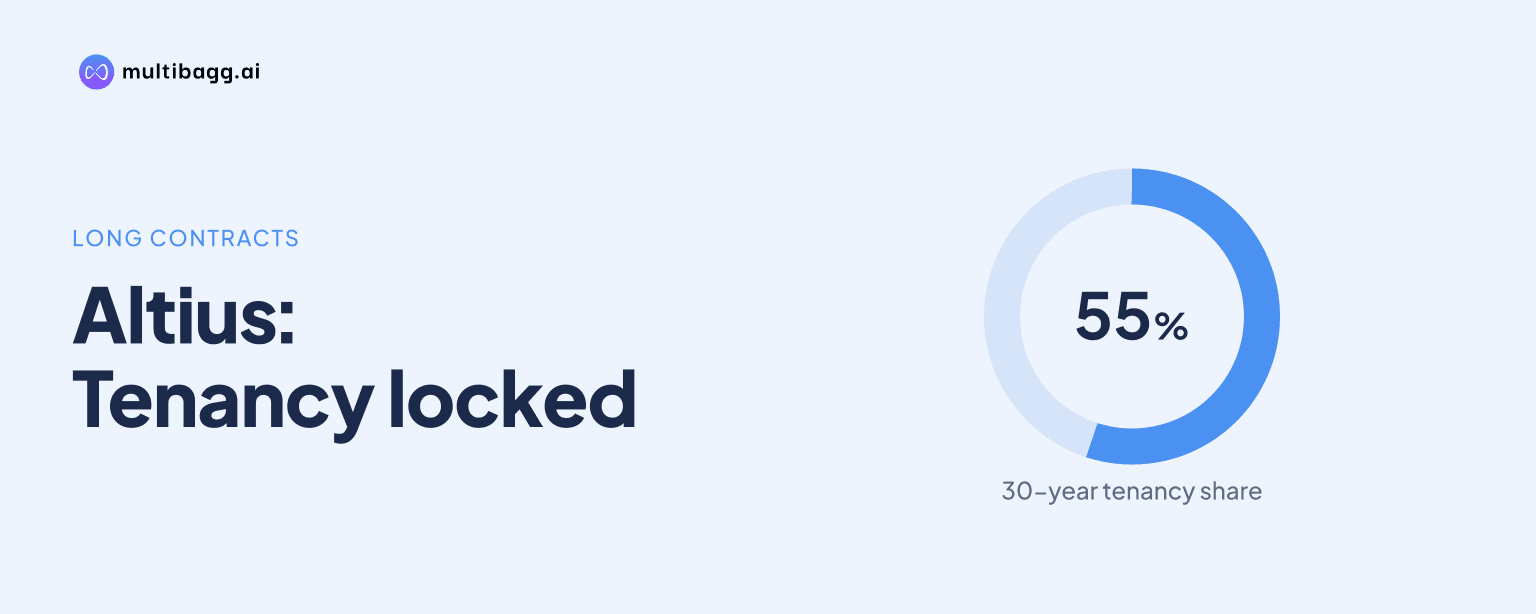
Altius reports that 55% of its tenancy share is locked in for up to 30 years, with 23.9 years of remaining lease term in that bucket, supporting a weighted average lease expiry of about 15.4 years. The remaining 45% is locked in for up to 10 years and has 4.9 years remaining.
Know Altius Telecom Infrastructure Trust inside out
Results, valuation, peers and who's buying, in one view.
How is Altius tenancy split between lock-in periods?
Altius divides tenancy share into 55% locked in for up to 30 years and 45% locked in for up to 10 years. The 30-year bucket has a remaining lease term of 23.9 years, while the 10-year bucket has 4.9 years remaining. The presentation therefore distinguishes the maximum lock-in period from the time still left under the contracts.
The longer-duration group exceeds the shorter-duration group by 10 percentage points of tenancy share. Altius does not provide tenant-by-tenant contract values, site counts by lock-in group or an annual expiry schedule on this page. The 55% and 45% measures therefore describe tenancy share, not the revenue that will expire in a specified financial year.
What does Altius's 15.4-year lease expiry profile indicate?
Altius reports a weighted average lease expiry, or WALE, of about 15.4 years. This portfolio measure lies between the 4.9-year remaining term for the up-to-10-year group and the 23.9-year remaining term for the up-to-30-year group. Altius attributes its stated revenue visibility to long-term Master Service Agreements, or MSAs.
The presentation describes the 15.4-year WALE as one of the best in the industry, citing Analysys Mason. However, it does not provide peer WALE figures, a comparison date or the methodology behind that industry statement. The directly disclosed data are the approximately 15.4-year WALE and the respective 55% and 45% tenancy-share split.
Altius also says long-term contracted costs provide downside protection. That statement concerns the cost structure alongside contractual revenue, but the presentation does not state the quantum of contracted costs, their expiry dates or whether their contractual periods match individual tenancy lock-ins. The disclosed contract-duration statistics should therefore not be read as a schedule of fixed revenue or costs for every future year.
How does tenant credit quality support Altius's revenue profile?
Altius says more than 80% of total revenue comes from tenants carrying AAA ratings from leading Indian rating agencies. This is a revenue-based disclosure rather than a count of tenants, towers or contracts. It complements the 15.4-year WALE by identifying the credit-rating category attached to most of the reported revenue base.
For one key counterparty, Altius cites group credit ratings of Baa1/Stable from Moody's, A-/Stable from Fitch and A-/Stable from S&P. The presentation compares these with India's sovereign ratings of Baa3/Stable from Moody's, BBB-/Stable from Fitch and BBB/Stable from S&P. Altius does not name this counterparty on the page or disclose its precise share of total revenue.
The credit and tenure disclosures measure different elements of the portfolio. More than 80% relates to revenue from AAA-rated tenants, while 55% relates to tenancy share locked in for up to 30 years. Neither figure identifies the amount of revenue due to expire in H1 FY27, FY27 or any later financial year.
Got a follow-up? Ask IRIS
What operating performance accompanied Altius's contract profile?
Altius reported 258,000 towers in H1 FY27, unchanged from FY26 and up from 257,000 in FY25. Its tenancy ratio was 1.2 times in H1 FY27, the same as FY25 and FY26, compared with 1.1 times in FY24. The presentation does not allocate the 258,000 towers or the 1.2-times ratio between the two lock-in buckets.
Adjusted revenue rose 3.6% to Rs 6,320.8 crore in H1 FY27 from Rs 6,101.8 crore in H1 FY26. Cash earnings before interest, tax, depreciation and amortisation, or cash EBITDA, increased 5.3% to Rs 4,335.7 crore from Rs 4,116.8 crore. Altius calculates adjusted revenue after energy and other recoveries, site-rent reimbursement and Ind AS 116 adjustments.
The H1 FY27 comparison shows adjusted revenue and cash EBITDA increased while the reported tower base and tenancy ratio remained at 258,000 and 1.2 times. The presentation does not provide a bridge linking the 3.6% revenue increase or the 5.3% cash EBITDA increase to the 15.4-year WALE. It therefore does not isolate the contribution of long-term lock-ins to the half-year movement.
What financial capacity does Altius report for growth capex?
Altius reported net debt to assets under management, or AUM, of 44.9%, against a 70.0% limit under InvIT regulations, subject to meeting the relevant criteria. Management presents this difference as headroom for growth capital expenditure. The same disclosure reports an 8.16% cost of debt and 75% fixed-rate borrowings.
Gross borrowings were Rs 44,900 crore, excluding mark-to-market provisions and unamortised borrowing costs, while closing cash was Rs 1,320 crore. The debt book included Rs 18,700 crore of domestic non-convertible debentures and Rs 12,600 crore of bank debt. These financing figures do not change the disclosed 55% tenancy share in up-to-30-year contracts.
Altius also reported adjusted revenue of Rs 12,300 crore and cash EBITDA of Rs 8,300 crore for FY26, with both figures rounded to the nearest billion in the presentation. For H1 FY27, adjusted revenue was Rs 6,300 crore and cash EBITDA was Rs 4,300 crore on the same rounded basis. The source identifies organic and inorganic opportunities but does not disclose a dated growth-capex commitment or acquisition plan.
Conclusion
Altius's contract disclosure shows that the larger 55% share of tenancy is locked in for up to 30 years and has 23.9 years remaining, compared with 45% locked in for up to 10 years with 4.9 years remaining. These groups underpin the reported WALE of about 15.4 years, while more than 80% of total revenue is attributed to AAA-rated tenants.
The next issue to watch is whether Altius uses the capacity it identifies for growth capex while maintaining its reported H1 FY27 operating profile of 258,000 towers and a 1.2-times tenancy ratio. Management reports net debt to AUM of 44.9% against a 70.0% regulatory limit, subject to applicable InvIT criteria, but the presentation does not provide a future contract-expiry calendar or dated capital-expenditure plan.