










Aptus grows Q2 FY27 AUM and disbursements 20%, RoA falls
Key highlights
- Aptus's Q2 FY27 AUM rose 20% year on year to Rs 14,177 crore.
- Aptus's Q2 FY27 disbursements increased 20% year on year to Rs 1,153 crore.
- Aptus reported Q2 FY27 PAT of Rs 267 crore, up 18% year on year.
- Aptus's RoA was 7.7% and gross NPA ratio was 1.68% in Q2 FY27.
powered by IRIS
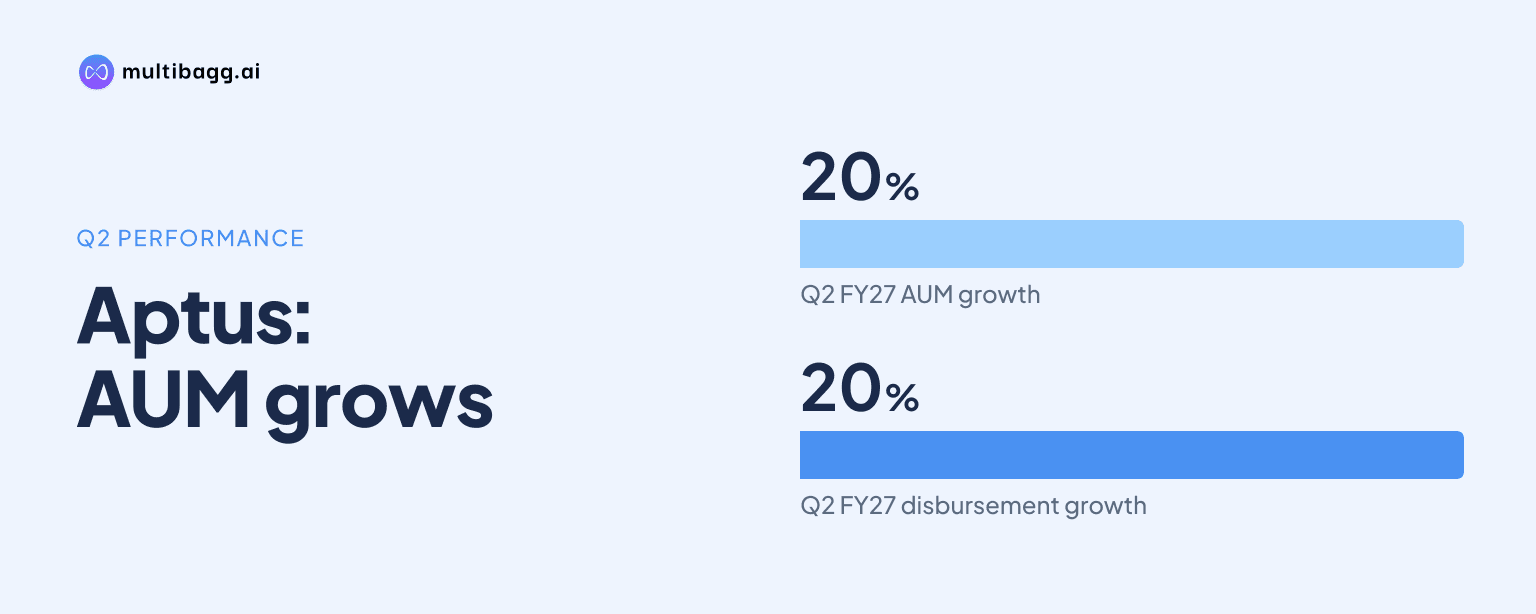
Aptus grew assets under management by 20% year on year to Rs 14,177 crore and disbursements by 20% to Rs 1,153 crore in Q2 FY27, while return on assets fell to 7.7% from 7.9%, a reported decline of 18 basis points. Profit after tax increased 18% to Rs 267 crore.
Know Aptus Value Housing Finance India inside out
Results, valuation, peers and who's buying, in one view.
How fast did Aptus grow in Q2 FY27?
Aptus grew assets under management, or AUM, by 20% year on year to Rs 14,177 crore in Q2 FY27 from Rs 11,767 crore in Q2 FY26. Disbursements also rose 20%, reaching Rs 1,153 crore from Rs 963 crore. The matching growth rates show that quarterly lending flow expanded at the same rate as the reported AUM over the year.
Aptus increased profit after tax, or PAT, by 18% to Rs 267 crore in Q2 FY27 from Rs 227 crore a year earlier. PAT growth was therefore below the 20% growth reported in AUM and disbursements. Return on equity, or ROE, was 20.1%, up 8 basis points from 20.0%, even as return on assets, or RoA, moved lower.
Did Aptus maintain its lending spread in Q2 FY27?
Aptus reported a spread of 8.9% in Q2 FY27, unchanged from Q2 FY26, as a 30-basis-point decline in yield to 17.0% was matched by a 30-basis-point fall in cost of borrowings to 8.1%. Yield was 17.3% and cost of borrowings was 8.4% in the year-earlier quarter.
The sequential comparison was different. Yield declined from 17.1% in Q1 FY27 to 17.0% in Q2 FY27, while cost of borrowings increased from 8.0% to 8.1%. Spread consequently declined from 9.0% in Q1 FY27 to 8.9% in Q2 FY27, although it remained equal to the Q2 FY26 level.
Aptus reported a FY26 yield of 17.2%, below 17.4% in FY25, while cost of borrowings fell to 8.3% from 8.7%. This moved full-year spread to 8.9% in FY26 from 8.7% in FY25. The Q2 FY27 yield of 17.0% was below the FY26 average, while the 8.1% borrowing cost was also below the FY26 average.
Why did Aptus's return on assets decline?
Aptus reported RoA of 7.7% in Q2 FY27, down from 7.9% in Q2 FY26, while PAT increased by Rs 40 crore to Rs 267 crore. The presentation reports a decline of 18 basis points in RoA but does not provide a quantified attribution for the change.
Operating-cost measures were higher in the latest quarter. Operating expenses as a share of average AUM were 2.8% in Q2 FY27, compared with 2.7% in both Q2 FY26 and Q1 FY27. Cost to total income reached 15.5%, up from 13.8% a year earlier and 14.8% in Q1 FY27.
The 15.5% cost-to-income ratio was also above the 14.4% reported for FY26 and 14.2% for FY25. Operating expenses to average AUM of 2.8% were 10 basis points above the FY26 level of 2.7%. These higher cost ratios coincided with a 10-basis-point sequential reduction in spread to 8.9%, but Aptus does not quantify their respective effects on RoA.
Got a follow-up? Ask IRIS
What changed in Aptus's asset quality during Q2 FY27?
Aptus reported a gross non-performing asset, or gross NPA, ratio of 1.68% in Q2 FY27, improving from 1.70% in Q1 FY27 but exceeding the 1.55% reported in Q2 FY26. The presentation states that the year-on-year increase was 13 basis points. Net NPA followed the same pattern, declining to 1.27% from 1.29% sequentially but remaining above 1.17% a year earlier.
Loans overdue by 30 days or more, reported as 30+ days past due, increased to 7.08% in Q2 FY27 from 6.87% in Q1 FY27 and 6.34% in Q2 FY26. Collection efficiency declined to 98.35%, compared with 98.52% in the preceding quarter and 99.36% a year earlier. The two measures show higher arrears and lower collection efficiency than in the year-earlier quarter.
At 30 September 2026, Aptus reported a total loan book of Rs 12,966.7 crore and expected credit loss provisions of Rs 133.7 crore, equal to a 1.0% provision coverage ratio. Gross Stage 3 loans were Rs 217.8 crore, or 1.7% of the portfolio, compared with Rs 176.9 crore, or 1.5%, at 30 September 2025. Stage 2 loans represented 5.4% of the portfolio, up from 4.8% a year earlier.
How is Aptus's loan portfolio positioned by product and customer?
Aptus reported Rs 10,086 crore of AUM in its housing finance company, or HFC, portfolio and Rs 4,091 crore in its non-banking financial company, or NBFC, portfolio. Home loans represented 67% of HFC AUM, followed by quasi-home loans at 26%, insurance loans at 4% and top-up loans at 3%. The NBFC portfolio consisted entirely of small-business loans and other non-home loans.
Aptus lists customer characteristics of 75% LIC customers, 81% largely self-employed customers and 86% rural focus. These disclosures provide portfolio context for Q2 FY27 AUM of Rs 14,177 crore and collection efficiency of 98.35%. The presentation does not provide separate Q2 FY27 profitability, delinquency or disbursement data for the HFC and NBFC portfolios.
Aptus describes a collection structure in which sales teams handle loans within their first 18 months, a centralised tele-calling team of about 25 members handles soft-bucket and first-bounce cases, and field collection officers manage overdue accounts. Legal recovery teams pursue non-performing asset resolution, including action under the Securitisation and Reconstruction of Financial Assets and Enforcement of Security Interest Act, or SARFAESI. The presentation does not quantify recoveries from each channel while the 30+ days-past-due ratio stood at 7.08% in Q2 FY27.
Conclusion
Aptus combined 20% growth in Q2 FY27 AUM and disbursements with an 18% increase in PAT, but RoA fell to 7.7% from 7.9%. Year-on-year spread held at 8.9%, while cost ratios increased and gross NPA, net NPA and 30+ days-past-due measures were above their Q2 FY26 levels.
The next results will clarify whether Aptus can improve the unresolved collection and cost measures identified in the presentation. Key disclosed markers are the 7.08% 30+ days-past-due ratio, 98.35% collection efficiency, 1.68% gross NPA ratio and 15.5% cost-to-income ratio reported in Q2 FY27.