










ARIS cuts working-capital days to 54, H1 cash flow Rs 60.1 crore
Key highlights
- ARIS reported Rs 60.1 crore of operating cash flow in H1 FY27, equal to 1.4 times Rs 42.9 crore of PAT.
- Net working-capital days fell to 54 in Q2 FY27 from 66 in FY26 and 110 in FY25.
- H1 FY27 revenue rose 32% year on year to Rs 598.5 crore, while EBITDA rose 63% to Rs 66.2 crore.
- Interest cover was 4.6 times in H1 FY27, compared with 2.5 times a year earlier.
powered by IRIS
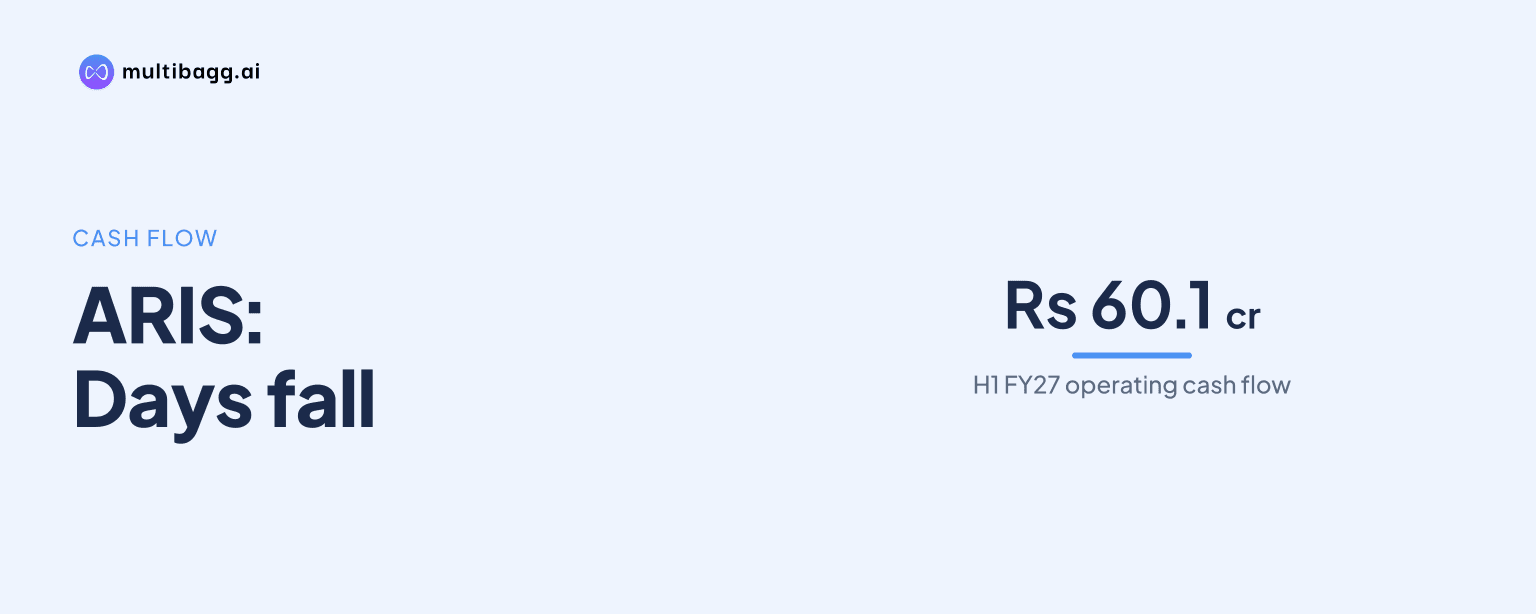
Arisinfra Solutions Limited reported Rs 60.1 crore of operating cash flow in H1 FY27, equal to 1.4 times its Rs 42.9 crore profit after tax, while net working-capital days declined to 54 in Q2 FY27 from 66 in FY26. The unaudited half-year figures show operating cash flow exceeded reported profit.
Know Arisinfra Solutions inside out
Results, valuation, peers and who's buying, in one view.
How did ARIS convert H1 FY27 profit into cash?
ARIS converted its Rs 42.9 crore H1 FY27 profit after tax (PAT) into Rs 60.1 crore of operating cash flow, a cash-flow-to-PAT ratio of 1.4 times. Earnings before interest, tax, depreciation and amortisation (EBITDA) were Rs 66.2 crore, leaving operating cash flow Rs 6.1 crore below EBITDA but Rs 17.2 crore above PAT. This comparison matters because PAT includes non-cash depreciation and amortisation of Rs 3.9 crore as well as finance costs of Rs 14.4 crore.
The Rs 60.1 crore cash-flow figure came as H1 FY27 revenue from operations rose 32% year on year to Rs 598.5 crore from Rs 453.3 crore. EBITDA increased 63% to Rs 66.2 crore from Rs 40.7 crore, while PAT increased 110% to Rs 42.9 crore from Rs 20.4 crore. The operating cash-flow figure is reported for H1 FY27, but the presentation does not provide a separate H1 FY26 operating cash-flow number, so a half-year cash-flow comparison cannot be made from the disclosed data.
Why did ARIS net working-capital days fall to 54?
ARIS reported net working-capital days of 54 in Q2 FY27, down from 56 in Q1 FY27 and 66 in FY26. The company defines net working-capital days as receivable days less payable days, calculated on average balances. On that measure, the Q2 FY27 result was 12 days below the FY26 level, 56 days below FY25's 110 days and 66 days below FY24's 120 days.
The reduction in days does not mean receivables fell in absolute rupee terms. Trade receivables were Rs 460.9 crore at 30 September 2026, compared with Rs 410.0 crore at 31 March 2026, while trade payables rose to Rs 204.5 crore from Rs 173.3 crore. As revenue expanded, both balances increased, but the disclosed days metric declined because it measures the difference between receivable and payable days rather than receivables alone.
What changed in ARIS earnings and financing costs?
ARIS improved its H1 FY27 EBITDA margin to 11.1% from 9.0% in H1 FY26, a rise of 210 basis points, where 100 basis points equal one percentage point. In Q2 FY27, revenue was Rs 307.7 crore, 6% above Rs 290.8 crore in Q1 FY27, and EBITDA was Rs 35.6 crore, 17% above Rs 30.5 crore. The sequential EBITDA increase exceeded revenue growth, taking the Q2 EBITDA margin to 11.6% from 10.5% in Q1.
Finance costs moved in the other direction over the half year, falling to Rs 14.4 crore in H1 FY27 from Rs 16.3 crore in H1 FY26 even as EBITDA rose to Rs 66.2 crore. ARIS consequently reported interest cover of 4.6 times for H1 FY27, compared with 2.5 times a year earlier; the company defines this ratio as EBITDA divided by finance cost. PAT margin rose to 7.2% from 4.5%, and return on capital employed, annualised for the part year, was 16.1% versus 15.8% in FY26.
Got a follow-up? Ask IRIS
What balance-sheet changes should readers consider alongside cash flow?
ARIS held Rs 258.8 crore of cash and bank balances at 30 September 2026, compared with Rs 119.2 crore at 31 March 2026. Including fixed deposits maturing beyond 12 months, total cash and bank balances were Rs 281.4 crore. Borrowings, both long and short term, were Rs 240.6 crore at 30 September, up from Rs 54.8 crore at the March year-end, while the reported net-debt-to-equity ratio was 0.10 times compared with negative 0.07 times in FY26.
The presentation therefore shows a higher cash balance and higher borrowings at the same date, rather than a disclosed use of operating cash flow to reduce gross borrowings. ARIS defines net debt to equity as borrowings less free cash and bank balances, divided by total equity. Equity attributable to owners was Rs 720.8 crore at 30 September 2026, down from Rs 739.1 crore at 31 March 2026, while total assets rose to Rs 1,266.6 crore from Rs 1,041.5 crore.
Can ARIS maintain its cash-conversion trend while growing?
ARIS has not disclosed a target for net working-capital days or operating cash flow, so the presentation does not establish a future cash-conversion threshold. It has, however, set FY27 management guidance for revenue growth of 35% to 40% and an EBITDA margin of 11.5% to 12.0%, versus revenue of Rs 1,067.5 crore and an EBITDA margin of 9.4% in FY26. These are management estimates and actual results may differ.
Management's stated 18-month priorities are to win more Developer as a Service mandates, add exclusive partner plants, and expand materials supply, contract manufacturing and Developer as a Service into new geographies. Contract manufacturing and Developer as a Service represented 56% of FY26 revenue under management's segmental breakup, and management expects them to represent 75% of FY30 revenue. The FY30 outlook calls for revenue of about Rs 3,000 crore, EBITDA margin of 12% to 13%, and PAT of about Rs 225 crore.
Conclusion
ARIS's H1 FY27 disclosure links a Rs 60.1 crore operating cash-flow result with PAT of Rs 42.9 crore and a decline in net working-capital days to 54. Revenue, EBITDA and PAT all increased year on year, while the working-capital-days measure fell from 66 in FY26, although trade receivables and payables both rose in absolute terms as the business expanded.
The next results will show whether ARIS can retain working-capital discipline while pursuing 35% to 40% FY27 revenue growth and its stated expansion in partner capacity, Developer as a Service and new geographies. Readers can also track whether finance costs, borrowings of Rs 240.6 crore and cash balances of Rs 258.8 crore move consistently with management's FY30 revenue and margin outlook.