










BigBloc H1 revenue rises 31% as loss narrows to Rs 3.5 crore
Key highlights
- BigBloc’s H1-FY27 revenue from operations rose 31.0% year on year to Rs 162 crore.
- BigBloc’s H1-FY27 EBITDA increased to Rs 9.6 crore from Rs 3.2 crore, while margin reached 5.93%.
- BigBloc’s H1-FY27 consolidated loss after tax narrowed to Rs 3.5 crore from Rs 8.1 crore.
- BigBloc’s H1-FY27 sales volumes increased 22% year on year to 4,46,769 CBM.
powered by IRIS
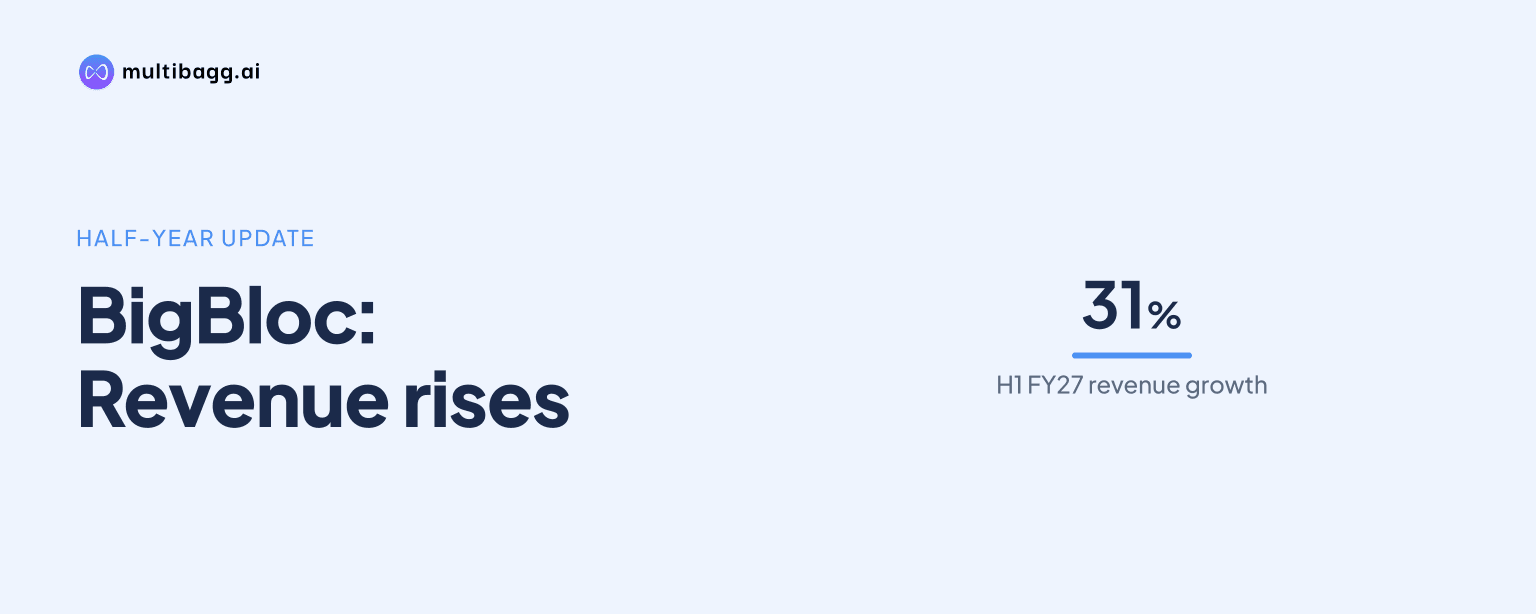
BigBloc Construction Limited increased H1-FY27 revenue from operations by 31% to Rs 162 crore and reduced its consolidated net loss to Rs 3.5 crore from Rs 8.1 crore a year earlier, but its EBITDA margin was 5.93%, below FY26’s 6.21% and Q1-FY27’s 7.96%.
Know BIGBLOC Construction inside out
Results, valuation, peers and who's buying, in one view.
How did BigBloc perform in H1-FY27?
BigBloc reported higher revenue, EBITDA and a narrower loss in H1-FY27. Revenue from operations increased by Rs 38.3 crore to Rs 162 crore from Rs 123.7 crore in H1-FY26, while earnings before interest, tax, depreciation and amortisation, or EBITDA, rose to Rs 9.6 crore from Rs 3.2 crore. EBITDA margin increased by 334 basis points, or 3.34 percentage points, to 5.93% from 2.59%.
The loss after tax narrowed by Rs 4.6 crore to Rs 3.5 crore, and the loss margin improved to 2.16% from 6.55%. Profit before tax remained negative at Rs 4.4 crore, compared with a loss before tax of Rs 9.6 crore in H1-FY26. Finance cost was unchanged at Rs 7.9 crore, depreciation rose 7.2% to Rs 8.9 crore, and other income declined 17.6% to Rs 2.8 crore.
Operating expenses grew more slowly than revenue in the half year. Expenses increased 26.5% to Rs 152.4 crore from Rs 120.5 crore, compared with the 31.0% revenue increase. That difference coincided with EBITDA rising by Rs 6.4 crore, although the company remained loss-making after depreciation, finance costs and tax.
Did sales volumes drive BigBloc’s H1-FY27 revenue growth?
BigBloc’s sales volumes contributed to revenue growth, rising 22% year on year to 4,46,769 cubic metres, or CBM, in H1-FY27 from 3,66,383 CBM in H1-FY26. Revenue grew faster than volume, at 31% versus 22%, but the presentation does not separate the effects of pricing, product mix or other factors on that difference.
Q2-FY27 volume was 2,25,241 CBM, up 13% from 1,98,545 CBM in Q2-FY26 and 1.7% above 2,21,545 CBM in Q1-FY27. Capacity utilisation was 69.34% in Q2-FY27 and 68.74% across H1-FY27. The company said it used gradual price revisions to respond to rising lime, coal and other input costs while seeking to retain market competitiveness and protect margins.
BigBloc also disclosed operating measures intended to improve efficiency. It installed 3.5 megawatts of rooftop solar capacity across all manufacturing plants during Q2-FY27, and cited automation in boiler operations and material-handling systems. The company also said it was moving from rented forklifts to an owned fleet of electric forklifts, but did not disclose associated savings or a quantified margin benefit.
Why did BigBloc’s Q2-FY27 EBITDA margin decline sequentially?
BigBloc’s Q2-FY27 EBITDA margin declined to 3.98% from 7.96% in Q1-FY27 because operating expenses increased faster than revenue. Quarterly revenue rose 4.8% to Rs 82.9 crore from Rs 79.1 crore, while operating expenses rose 9.3% to Rs 79.6 crore from Rs 72.8 crore. EBITDA consequently fell 47.6% to Rs 3.3 crore from Rs 6.3 crore.
The year-on-year comparison was more favourable. Q2-FY27 revenue was 23.2% above Rs 67.3 crore in Q2-FY26, while EBITDA increased from Rs 1.9 crore to Rs 3.3 crore. EBITDA margin improved by 116 basis points from 2.82% in Q2-FY26, although the Q2-FY27 margin remained below the H1-FY27 level of 5.93%.
The quarter still produced a Rs 2.7 crore loss after tax, compared with losses of Rs 0.7 crore in Q1-FY27 and Rs 3.2 crore in Q2-FY26. Depreciation was Rs 4.5 crore and finance cost was Rs 4 crore in Q2-FY27, against EBITDA of Rs 3.3 crore. Other income of Rs 1.5 crore left the company with a Rs 3.7 crore loss before tax.
Got a follow-up? Ask IRIS
How do BigBloc’s margins compare with earlier years?
BigBloc’s H1-FY27 EBITDA margin of 5.93% remained below its annual margin in FY26 and substantially below the preceding two financial years. The margin declined from 23.07% in FY24 to 13.00% in FY25 and 6.21% in FY26. EBITDA fell from Rs 56.1 crore in FY24 to Rs 29.2 crore in FY25 and Rs 17.6 crore in FY26.
Revenue moved differently over the same years. It declined to Rs 224.6 crore in FY25 from Rs 243.2 crore in FY24, then increased to Rs 283.4 crore in FY26. H1-FY27 revenue of Rs 162 crore represented 57% of FY26 revenue, but a six-month result is not directly comparable with a full-year figure.
Profit after tax changed from a Rs 30.7 crore profit in FY24 to Rs 3.2 crore in FY25, followed by an Rs 8.5 crore loss in FY26. The H1-FY27 loss of Rs 3.5 crore was narrower than the Rs 8.1 crore loss in H1-FY26, while the loss margin improved to 2.16% from 6.55%. Finance cost was Rs 7.9 crore in both H1-FY26 and H1-FY27.
What changed in BigBloc’s balance sheet at H1-FY27?
BigBloc reported total assets of Rs 387.6 crore at H1-FY27, compared with Rs 388.5 crore at FY26. Property, plant and equipment increased to Rs 237.5 crore from Rs 234.9 crore, while capital work in progress fell to Rs 0.2 crore from Rs 9.6 crore. The presentation does not explain the movements in individual projects or assets.
Borrowings shifted toward shorter maturities. Long-term borrowings declined to Rs 111.6 crore at H1-FY27 from Rs 114.4 crore at FY26, while short-term borrowings increased to Rs 91 crore from Rs 87.2 crore. Trade receivables rose to Rs 70.3 crore from Rs 66.7 crore, and cash and bank balances declined to Rs 5 lakh from Rs 6 lakh.
The reported net-debt-to-equity ratio was 1.4 times at H1-FY27, unchanged from FY26. Shareholders’ funds declined to Rs 143 crore from Rs 146.3 crore over the same period, while total current liabilities increased to Rs 131.6 crore from Rs 126.4 crore. Inventory increased to Rs 24 crore from Rs 23 crore.
Conclusion
BigBloc’s H1-FY27 figures show volume-led revenue growth and a material reduction in the net loss, with revenue up 31%, EBITDA rising to Rs 9.6 crore and the loss after tax narrowing to Rs 3.5 crore. The results also show that profitability remains unresolved: the 5.93% H1 EBITDA margin was below FY26’s 6.21%, and Q2 margin fell to 3.98% from 7.96% in Q1.
The next reported period will indicate whether gradual price revisions, automation, owned electric forklifts and 3.5 megawatts of rooftop solar capacity affect costs as utilisation moves beyond 68.74%. Management has also disclosed 57,500 square metres of land in Madhya Pradesh for central India expansion, entry into AAC wall panels and NXTGRIP tile adhesive, but the presentation gives no financial target or commissioning schedule for these initiatives.