










Chetana Education H1 FY27 profit rises 28% on margins
Key highlights
- Chetana Education reported H1 FY27 revenue from operations of Rs 65.63 crore, up 12.1% year on year.
- Chetana Education’s H1 FY27 EBITDA rose 27.0% to Rs 17.47 crore and EBITDA margin reached 26.6%.
- Chetana Education’s H1 FY27 PAT increased 28.3% to Rs 12.07 crore, with PAT margin rising to 18.4%.
- Chetana Education’s H1 FY27 revenue was 29.4% higher than H2 FY26, while EBITDA was 117.1% higher.
powered by IRIS
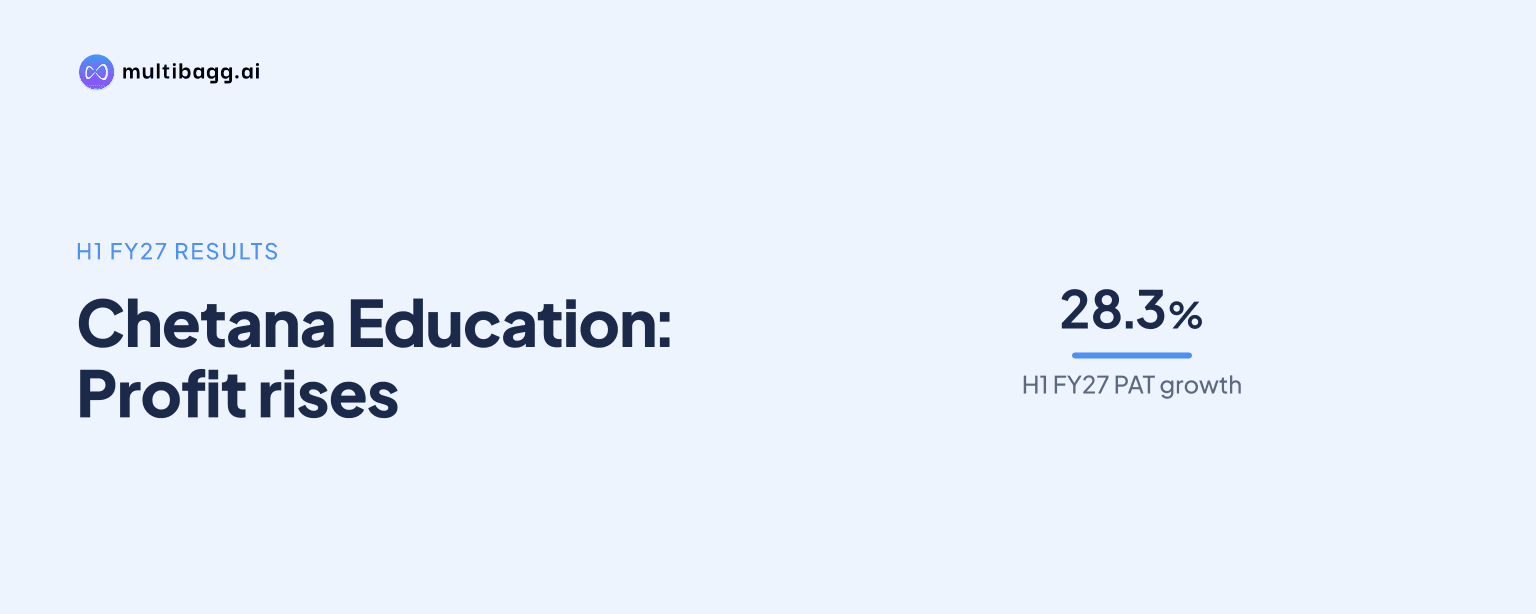
Chetana Education Limited (Chetana Education) reported H1 FY27 profit for the period of Rs 12.07 crore, up 28.3% from H1 FY26, as earnings before interest, tax, depreciation and amortisation (EBITDA) margin rose to 26.6% from 23.5%. Revenue from operations increased 12.1% to Rs 65.63 crore, so profit grew faster than sales.
Know Chetana Education inside out
Results, valuation, peers and who's buying, in one view.
How did Chetana Education perform in H1 FY27?
Chetana Education reported revenue from operations of Rs 65.63 crore in H1 FY27, compared with Rs 58.56 crore in H1 FY26, a 12.1% increase. Gross profit rose 12.9% to Rs 37.59 crore from Rs 33.30 crore, while gross profit margin increased by 0.4 percentage points to 57.3% from 56.9%.
EBITDA reached Rs 17.47 crore in H1 FY27, up 27.0% from Rs 13.75 crore a year earlier. Profit for the period, or profit after tax (PAT), increased to Rs 12.07 crore from Rs 9.41 crore, a 28.3% rise. The growth in PAT exceeded both revenue growth and the increase in gross profit.
What changed in Chetana Education’s margins?
Chetana Education’s EBITDA margin expanded by 3.1 percentage points to 26.6% in H1 FY27 from 23.5% in H1 FY26. PAT margin rose by 2.3 percentage points to 18.4% from 16.1%, and gross profit margin increased to 57.3% from 56.9%. The reported margin movement accompanied earnings growth that exceeded the rate of revenue growth.
Earnings before interest and tax (EBIT) increased 27.1% to Rs 16.93 crore from Rs 13.33 crore. Profit before tax (PBT) rose 26.8% to Rs 16.00 crore from Rs 12.62 crore, while total tax expense increased to Rs 3.93 crore from Rs 3.22 crore. Despite the higher tax expense, PAT margin rose because post-tax profit increased faster than revenue.
How did H1 FY27 compare with H2 FY26 for Chetana Education?
Chetana Education’s H1 FY27 revenue of Rs 65.63 crore was 29.4% higher than Rs 50.71 crore in H2 FY26. Gross profit rose 13.5% from Rs 33.12 crore to Rs 37.59 crore, although gross profit margin declined to 57.3% from 65.3% in the preceding half-year.
EBITDA increased 117.1% to Rs 17.47 crore from Rs 8.05 crore in H2 FY26, and EBITDA margin rose to 26.6% from 15.9%. PAT rose 198.1% to Rs 12.07 crore from Rs 4.05 crore, while PAT margin increased to 18.4% from 8.0%. This comparison shows higher operating and net margins despite the lower gross margin.
The H2 FY26 statement includes an exceptional item of Rs 52.25 lakh, whereas the H1 FY27 statement reports no exceptional item. PBT was Rs 16.00 crore in H1 FY27, 170.1% above Rs 5.92 crore in H2 FY26. The presentation therefore shows that the half-on-half increase in profit occurred alongside higher revenue, a higher EBITDA margin and no reported exceptional item in H1 FY27.
Got a follow-up? Ask IRIS
Which costs affected Chetana Education’s H1 FY27 earnings?
Chetana Education’s cost of materials consumed rose to Rs 28.03 crore in H1 FY27 from Rs 25.25 crore in H1 FY26. Revenue increased by Rs 7.07 crore over that period, while gross profit increased by Rs 4.29 crore. The resulting gross margin increased by 0.4 percentage points.
Employee benefits expense was Rs 11.47 crore in H1 FY27, compared with Rs 11.09 crore a year earlier, and other expenses were Rs 8.66 crore against Rs 8.47 crore. Together, these two expense lines increased by Rs 57.43 lakh, compared with a Rs 3.72 crore increase in EBITDA. The presentation provides no segment-level revenue or expense split and does not identify products or business lines behind the margin change.
Depreciation and amortisation expense increased to Rs 56.50 lakh from Rs 46.63 lakh, while finance costs rose to Rs 93 lakh from Rs 70.22 lakh. Other income declined to Rs 2.78 lakh from Rs 4.21 lakh. Against these below-EBITDA movements, EBIT increased by Rs 3.61 crore and PBT increased by Rs 3.38 crore year on year.
Conclusion
Chetana Education’s H1 FY27 results show profit rising faster than revenue: revenue grew 12.1% to Rs 65.63 crore, EBITDA increased 27.0% to Rs 17.47 crore and PAT rose 28.3% to Rs 12.07 crore. Gross profit, EBITDA and PAT margins all increased from H1 FY26, while the comparison with H2 FY26 shows a lower gross margin but higher EBITDA and PAT margins.
What to watch next is whether Chetana Education can sustain its 26.6% H1 FY27 EBITDA margin as revenue develops beyond the reported half year, particularly after H2 FY26 recorded a 65.3% gross margin and a 15.9% EBITDA margin. The presentation also says Chetana Education intends to accelerate educational-support initiatives through the Rotary Club of Borivali Charitable Trust in the upcoming period, without disclosing a financial target or timetable.