










Chola borrowings reach Rs 2.31522 lakh crore in Q2 FY27
Key highlights
- Chola reported Q2 FY27 total borrowings of Rs 2.31522 lakh crore, up Rs 44,007 crore from Q2 FY26.
- Banks supplied 51% of Chola's Q2 FY27 borrowings by investor type, unchanged from Q2 FY26.
- Chola reported Rs 21,352 crore of cash and Rs 21,974 crore of total liquidity at the end of September 2026.
- Chola's Q2 FY27 total CAR was 20.62%, against the RBI minimum requirement of 15%.
powered by IRIS
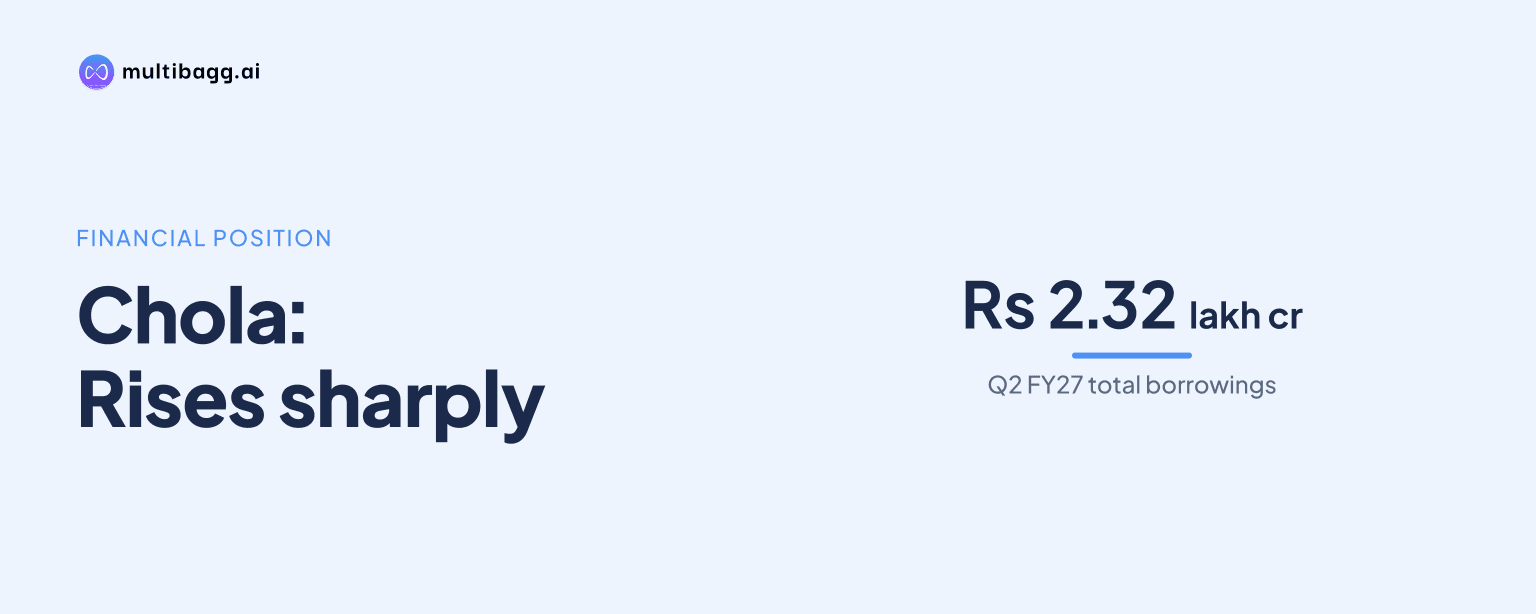
Chola Financial Holdings reported total borrowings of Rs 2.31522 lakh crore in Q2 FY27, up Rs 44,007 crore from Q2 FY26, with banks accounting for 51% by investor type. Chola also reported Rs 21,352 crore of cash and Rs 21,974 crore of total liquidity at the end of September 2026.
Know Cholamandalam Financial Holdings inside out
Results, valuation, peers and who's buying, in one view.
How much did Chola borrow in Q2 FY27?
Chola borrowed Rs 2.31522 lakh crore in Q2 FY27, compared with Rs 1.87515 lakh crore in Q2 FY26. The Rs 44,007 crore increase came over four reported quarters. The presentation reports period-end balances and does not specify the use of the additional borrowing.
Borrowings increased in every reported quarter, from Rs 1.97810 lakh crore in Q3 FY26 to Rs 2.10867 lakh crore in Q4 FY26 and Rs 2.20247 lakh crore in Q1 FY27. The Rs 9,275 crore increase in Q2 FY27 was lower than the Rs 13,057 crore rise in Q4 FY26, but lifted total borrowings above Rs 2 lakh crore.
Which sources fund Chola's borrowings?
Banks provided 51% of Chola's Q2 FY27 borrowings by investor type, unchanged from Q2 FY26 and Q1 FY27. Securitisation was the next-largest investor category at 16%, also unchanged year on year, while overseas banks through external commercial borrowings, or ECB, accounted for 7% and international financial institutions, or IFIs, for 6%.
By instrument, bank term loans accounted for 44% in Q2 FY27, versus 43% in Q2 FY26. Private debentures rose to 13% from 11%, Tier II capital increased to 8% from 6%, and securitisation rose to 16% from 15%. Commercial paper and inter-corporate deposits, or ICDs, declined to 4% from 5%, while compulsory convertible debentures fell from 1% to zero.
The investor and instrument tables classify the same borrowing base differently. The 51% bank share is based on lender type, whereas the 44% bank-term-loan share is based on instrument type. Overseas-bank ECB funding is separately shown as 7% in the investor table and ECB or foreign currency non-resident funding as 7% in the instrument table.
Got a follow-up? Ask IRIS
Does Chola's ALM cover near-term cash flows?
Chola reported a positive cumulative asset-liability management, or ALM, gap of Rs 7,472.93 crore through the more-than-six-month-to-one-year bucket on 30 September 2026. Cumulative inflows were Rs 1,02,682.35 crore and cumulative outflows were Rs 95,209.42 crore, producing a cumulative gap equal to 7.85% of outflows.
In the one-month bucket, total inflows of Rs 13,486.21 crore exceeded total outflows of Rs 10,738.16 crore by Rs 2,748.05 crore. The resulting cumulative gap was 25.59% of outflows. Individual gaps were also positive in the one-to-two-month, two-to-three-month, three-to-six-month and more-than-six-month-to-one-year buckets.
The maturity profile included negative individual gaps beyond one year. Chola reported a Rs 5,075.63 crore shortfall in the more-than-one-to-three-year bucket and a Rs 5,804.37 crore shortfall beyond five years. Cumulatively, however, the gap remained positive at Rs 2,397.31 crore through one-to-three years and Rs 5,804.37 crore through three-to-five years, before reaching zero at the final bucket.
Cash and bank balances in the ALM statement totalled Rs 21,351.56 crore, including Rs 5,230.24 crore in the one-month bucket. Separately, Chola stated cash of Rs 21,352 crore at September-end, including Rs 7,745.42 crore of high-quality liquid assets, or HQLA, in government securities, state development loans and strips for liquidity coverage ratio, or LCR, compliance. Total liquidity, including undrawn sanctioned lines, was Rs 21,974 crore.
What capital and credit ratings does Chola report?
Chola reported a total capital adequacy ratio, or CAR, of 20.62% in Q2 FY27, above the Reserve Bank of India, or RBI, minimum of 15%. Tier I capital was 16.02%, above the 10% minimum. Total CAR increased from 19.81% in Q1 FY27 and 19.21% in FY26.
Tier I rose from 14.81% in Q1 FY27 and 14.73% in FY26, while Tier II declined to 4.60% from 5.00% in Q1 FY27. The presentation does not provide a bridge for the 0.81-percentage-point quarterly increase in total CAR or the movement between its Tier I and Tier II components.
For long-term non-convertible debentures, or NCDs, and cash-credit facilities, Chola lists IND AA+ with a stable outlook from India Ratings, CARE AA+ with a stable outlook, and ICRA AA+ with a positive outlook. For short-term commercial paper, working-capital demand loans and cash credit, the presentation lists CARE A1+, ICRA A1+ and CRISIL A1+.
Conclusion
Chola's Q2 FY27 disclosures show a Rs 2.31522 lakh crore borrowing base funded primarily by banks, which retained a 51% share by investor type, alongside a 16% securitisation share. The company reported positive cumulative ALM gaps through the three-to-five-year bucket, cash of Rs 21,352 crore and total liquidity of Rs 21,974 crore.
The next disclosure should clarify whether the rise in private debentures to 13%, Tier II capital to 8% and bank term loans to 44% continues. Investors can also watch the negative individual ALM gaps in the more-than-one-to-three-year and beyond-five-year buckets, and whether Chola explains the drivers of incremental borrowings and capital-ratio movements.