










CMS H1 operating cash flow reaches ₹177 crore after outflow
Key highlights
- CMS reported ₹177 crore of H1 FY27 operating cash flow, versus a ₹117 crore outflow in H1 FY26.
- H1 FY27 operating cash flow equalled 51% of EBITDA, compared with negative 39% a year earlier.
- CMS targets ₹100-125 crore of FY27E capex after deploying ₹351 crore in FY26.
- CMS reported ₹473 crore of net cash as of 30 September 2026.
powered by IRIS
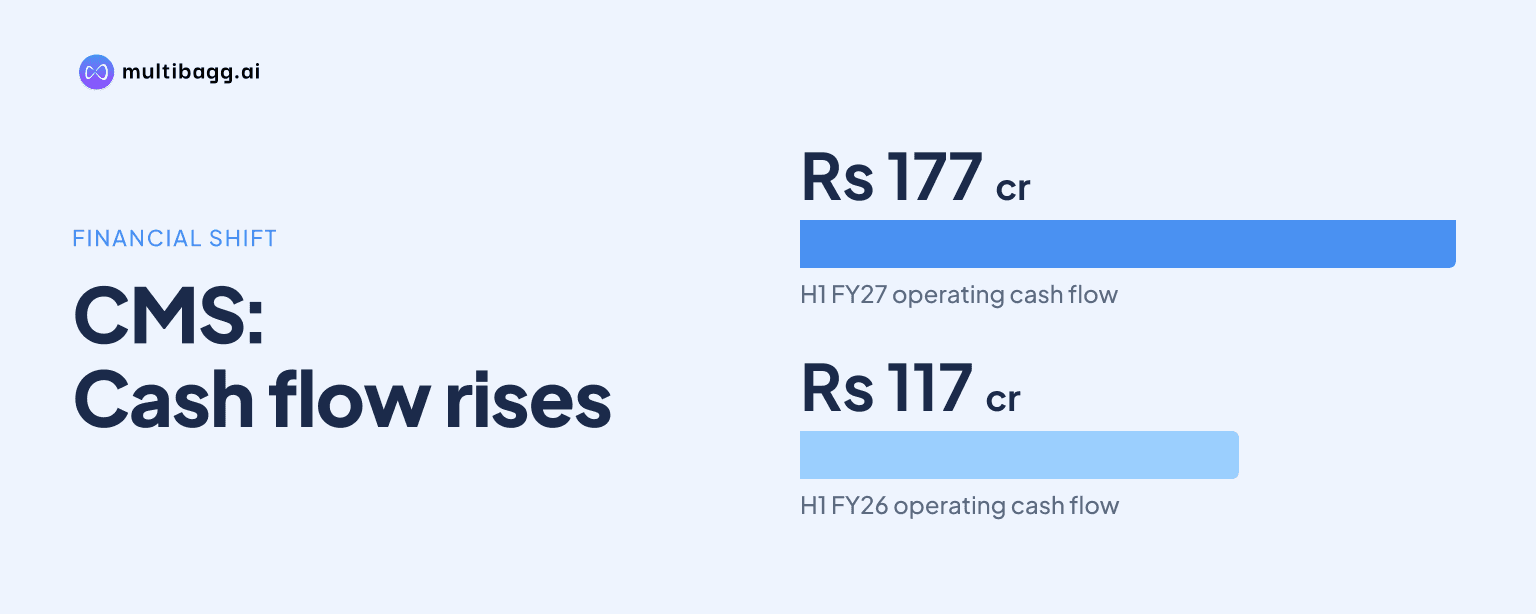
CMS reported ₹177 crore of operating cash flow in the first half (H1) of financial year (FY) 2027, reversing a ₹117 crore outflow in H1 FY26. Operating cash flow equalled 51% of earnings before interest, tax, depreciation and amortisation (EBITDA), while CMS plans ₹100-125 crore of FY27 capital expenditure after ₹351 crore in FY26.
Know CMS Info Systems inside out
Results, valuation, peers and who's buying, in one view.
How did CMS operating cash flow change in H1 FY27?
CMS generated ₹177 crore of operating cash flow (OCF) in H1 FY27, compared with an OCF outflow of ₹117 crore in H1 FY26. This was a ₹294 crore swing between the two first-half periods, while OCF as a proportion of EBITDA moved to 51% from negative 39%.
CMS's H1 FY27 OCF also exceeded the ₹110 crore reported in H1 FY24 and followed ₹11 crore in H1 FY25. The 51% H1 FY27 OCF-to-EBITDA ratio was above 37% in H1 FY24, although CMS separately reports a 71% average ratio for FY22 to FY26.
CMS had net cash of ₹473 crore as of 30 September 2026. It also reported ₹606 crore returned to shareholders, comprising ₹438 crore of dividends and ₹168 crore through buybacks, but did not disclose how the ₹177 crore H1 FY27 OCF was allocated to distributions or other uses.
What does CMS disclose about the improved cash conversion?
CMS does not provide a line-item bridge for the change from the ₹117 crore H1 FY26 OCF outflow to the ₹177 crore H1 FY27 inflow. It reported an H1 FY27 EBITDA margin of 27.0%, up 290 basis points year on year, alongside the 51% OCF-to-EBITDA ratio.
A basis point is one-hundredth of a percentage point. CMS said network efficiency rose 10% through machine-learning-based optimisation, while artificial-intelligence agents processed incidents at 99% accuracy and closed more than 60% of monitoring alerts across more than 25,000 sites; these measures were presented as margin supports rather than quantified OCF drivers.
CMS reported cost pressure from minimum-wage increases of 6% to 60% across key states and an 8% fuel-price increase over the preceding six months. Revised prices were in place across most private-bank automated teller machine (ATM) contracts and retail customers, while public-sector bank negotiations were underway through an Indian Banks' Association committee.
Tech & Payments represented 20% of services revenue in Q2 FY27, compared with 16% in FY26. Its annualised revenue was ₹508 crore in Q2 FY27, versus ₹375 crore in FY26, but CMS did not disclose separate segment cash conversion or attribute any part of H1 OCF to this business mix change.
Got a follow-up? Ask IRIS
What is CMS's FY27 capital expenditure plan?
CMS plans FY27 estimated capital expenditure, or capex, of ₹100-125 crore, equivalent to about 4% of revenue, after deploying ₹351 crore in FY26. The planned range is ₹226-251 crore below the FY26 amount, and CMS says FY27 spending will be mainly in Tech & Payments rollouts.
CMS said the ₹351 crore invested in FY26 funded fixed-price ATM contract rollouts and the development of HAWKAI and ALGO MVS. The FY27E range is close to the ₹99 crore reported in FY24 and below the ₹129 crore spent in FY25.
Management said capex investment is at 50% of long-term levels and expects depreciation as a share of revenue to ease from FY28 as revenue from earlier investments builds. This is management's outlook rather than a reported FY27 or FY28 result.
How is CMS shifting investment between ATM contracts and Tech & Payments?
CMS is limiting investment in transaction-linked ATMs while directing FY27 capex mainly towards Tech & Payments rollouts. Transaction-linked ATM capex was ₹10.6 crore in H1 FY27, down 63% year on year, and CMS said that expenditure was limited to contractual deployments.
During FY24 and FY25, CMS said it stayed out of most transaction-priced brown-label ATM tenders and reduced annual capex from about ₹200 crore to ₹100 crore. In FY26, CMS said all order wins used fixed-fee models and that it declined a ₹700 crore transaction-priced contract.
India's off-site ATM base fell from 88,000 in September 2024 to 73,000 in September 2026, according to the presentation. Over the same period, on-site ATMs rose from 128,000 to 137,000, while the total ATM base declined from 215,700 to 209,800.
CMS reported ₹700 crore of H1 FY27 order wins in Tech & Payments. These included a HAWKAI Branch RMS win covering a central command centre and more than 8,000 branches for a leading public-sector bank, plus an ALGO MVS rollout across 12,000 machines for another leading public-sector bank.
Conclusion
CMS's H1 FY27 cash flow moved from a ₹117 crore outflow a year earlier to a ₹177 crore inflow, with OCF reaching 51% of EBITDA. The company is pairing that improvement with a FY27E capex range of ₹100-125 crore, well below the ₹351 crore deployed in FY26, while reporting ₹473 crore of net cash at 30 September 2026.
The next disclosed milestones are execution of the FY27 Tech & Payments rollout plan, revenue build from the FY26 investments and management's expectation of lower depreciation as a share of revenue from FY28. CMS also has public-sector bank repricing negotiations underway and targets final closing of the FSS CashTech integration by January 2027.