










CMS Q2 EBITDA Margin Reaches 26.7%, Outpacing PAT Growth
Key highlights
- CMS Q2 FY27 EBITDA margin rose 390 bps year on year to 26.7%.
- CMS Q2 FY27 EBITDA increased 24.8% to Rs 173 crore, while PAT rose 10.3% to Rs 81 crore.
- Managed Services revenue rose 19% year on year to Rs 321 crore in Q2 FY27.
- CMS management guides for FY27 total revenue of Rs 2,750 crore to Rs 2,850 crore and EBITDA margin of about 27%.
powered by IRIS
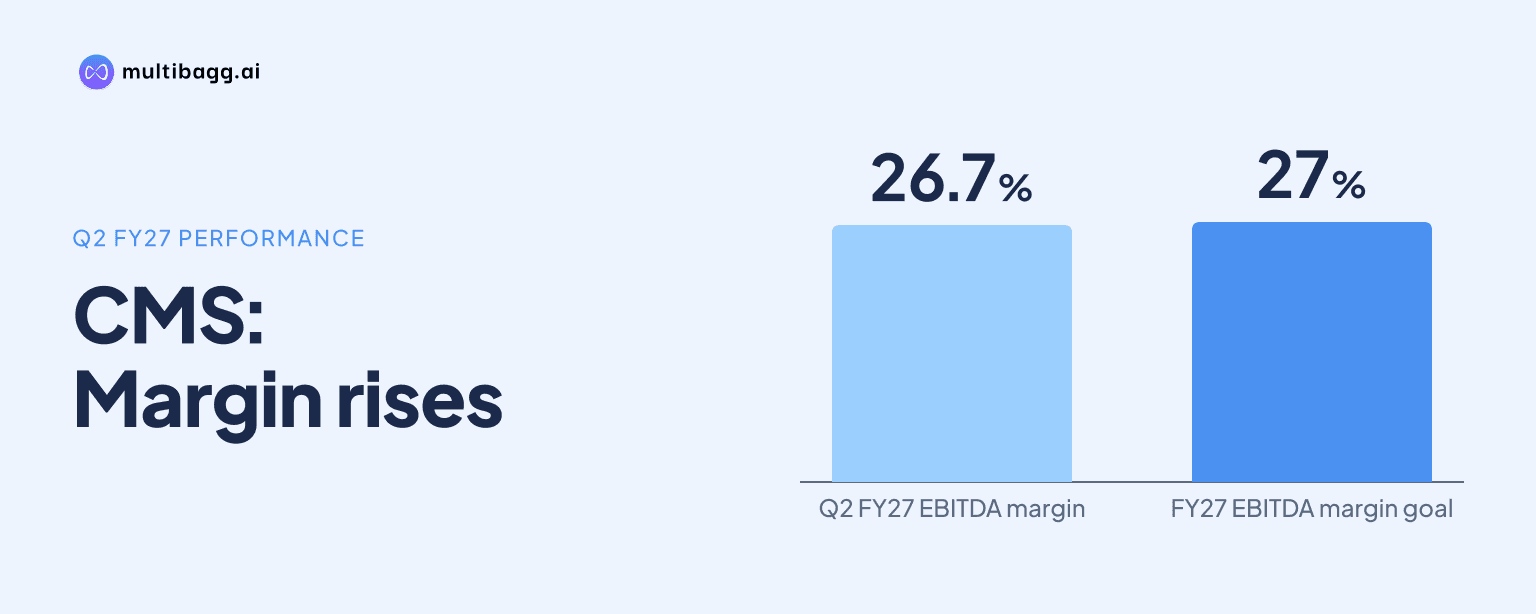
CMS reported a 26.7% earnings before interest, tax, depreciation and amortisation (EBITDA) margin in Q2 FY27, up 390 basis points (bps) year on year, as EBITDA rose 24.8% to Rs 173 crore while profit after tax (PAT) increased 10.3% to Rs 81 crore. Services revenue grew 16.2% to Rs 644 crore.
Know CMS Info Systems inside out
Results, valuation, peers and who's buying, in one view.
How did CMS increase its Q2 FY27 EBITDA margin?
CMS increased its Q2 FY27 EBITDA margin to 26.7% from 22.8% in Q2 FY26, with EBITDA rising by Rs 34 crore to Rs 173 crore. Total revenue grew by Rs 41 crore year on year to Rs 650 crore, while services revenue increased by Rs 90 crore to Rs 644 crore. CMS lists price revisions with most private-sector banks and retail customers, a 10% route-network reduction, and integration of Securens and FSS among completed actions after the FY26 reset.
The sequential comparison was different: EBITDA was broadly unchanged at Rs 173 crore in Q2 FY27, while margin declined by 53 bps from 27.2% in Q1 FY27. Total revenue rose 2.4% from Rs 635 crore and services revenue rose 3.0% from Rs 625 crore. Thus, the year-on-year margin expansion did not continue on a quarter-on-quarter basis.
CMS also reported a changing services mix in Q2 FY27. Technology and Payments represented 20% of services revenue, compared with 16% in FY26 and 7% in FY22. CMS’s FY30 aspiration is for Technology and Payments to contribute 20% to 22% of services revenue, while ATM Management Solutions moves from 56% in Q2 FY27 to 50% to 52%.
Why did CMS PAT rise more slowly than EBITDA?
CMS PAT rose more slowly because Q2 FY27 included about Rs 2.5 crore of lower other income after the buyback, while the preceding quarter had a one-time deferred-tax gain. Q2 PAT increased 10.3% year on year to Rs 81 crore, compared with EBITDA growth of 24.8% to Rs 173 crore. The presentation identifies those items but does not give a full company-wide reconciliation from EBITDA to PAT.
The half-year figures show a wider gap between operating and net-profit trends. H1 FY27 EBITDA rose 16.4% to Rs 346 crore and margin expanded by 290 bps to 27.0%, but PAT declined 1.4% to Rs 165 crore from Rs 167 crore in H1 FY26. Diluted earnings per share (EPS) increased 1.4% to Rs 10.15, from Rs 10.01.
CMS also identified higher depreciation in Managed Services from FY26 capital expenditure and the FSS acquisition. The segment’s earnings before interest and tax (EBIT) reflected lower transaction-linked ATM revenue as well as that depreciation. These are segment disclosures rather than quantified explanations for the full difference between Q2 EBITDA and PAT.
Got a follow-up? Ask IRIS
Which CMS segment drove Q2 FY27 revenue growth?
Managed Services drove the larger Q2 FY27 revenue increase, with revenue up 19% year on year to Rs 321 crore, while Cash revenue rose 2% to Rs 404 crore. Managed Services also grew 5% from Rs 305 crore in Q1 FY27, whereas Cash revenue was broadly flat from Rs 403 crore. Segment revenue exceeds reported total revenue because CMS states that consolidated totals are net of inter-segment revenue and corporate costs.
Cash generated Rs 77 crore of Q2 FY27 EBIT, compared with Rs 34 crore for Managed Services, and recorded a 19.1% EBIT margin versus 10.6% for Managed Services. Cash EBIT rose 31% year on year from Rs 59 crore, although it fell 6% sequentially from Rs 82 crore. Managed Services EBIT declined 10% year on year from Rs 38 crore but increased 8% from Rs 32 crore in Q1 FY27.
The margin movements were also different across the two segments. Cash EBIT margin rose from 14.9% in Q2 FY26 to 19.1% in Q2 FY27, but eased from 20.3% in Q1 FY27. Managed Services EBIT margin fell from 14.0% a year earlier to 10.6%, while improving from 10.3% in Q1 FY27; CMS attributes this to lower transaction-linked ATM revenue and higher depreciation.
What is CMS planning for H2 FY27 and FY27?
CMS is pursuing fixed-fee ATM contracts and said all FY27 order wins were on that model, while it declined a Rs 700 crore transaction-priced contract. Its H1 FY27 capital expenditure in transaction-linked ATMs was Rs 10.6 crore, down 63% year on year and limited to contractual deployments. CMS had previously reduced annual capital expenditure from about Rs 200 crore to Rs 100 crore in FY24-FY25.
For H2 FY27, CMS lists execution of Technology and Payments wins, public-sector bank price revisions led through the Indian Banks’ Association, and delivery of recycler orders. Product revenue was lower year on year in Q2 FY27 because deliveries on public-sector bank recycler orders won during the year are scheduled for H2. CMS also said currency supply and ATM dispense per ATM had recovered 8% from the May low.
Management’s FY27 outlook calls for services revenue of Rs 2,650 crore to Rs 2,750 crore, total revenue of Rs 2,750 crore to Rs 2,850 crore, and an EBITDA margin of about 27%. It expects FY27 capital expenditure of Rs 100 crore to Rs 125 crore, compared with Rs 351 crore in FY26. These are management targets and plans, not reported results.
Conclusion
CMS’s Q2 FY27 results show operating profit expanding faster than net profit: EBITDA increased by Rs 34 crore year on year and margin reached 26.7%, while PAT increased by Rs 8 crore to Rs 81 crore. Services revenue, led by Managed Services, supplied most of the revenue increase, while Cash retained the higher segment EBIT margin at 19.1%.
The next disclosed milestones are H2 FY27 recycler-order deliveries, execution of Technology and Payments wins, and public-sector bank price revisions. Management’s targets of about 27% EBITDA margin, Rs 2,750 crore to Rs 2,850 crore of FY27 total revenue, and Rs 100 crore to Rs 125 crore of capital expenditure provide the benchmarks for subsequent results.