










Coforge Ltd Breaks Consolidation, Reaches Rs 2,153 High
Key highlights
- Coforge rose 5.14% on 20 November 2026 and touched a reported all-time high of Rs 2,153.35.
- Coforge broke above a consolidation range that had lasted for more than two months, with Rs 2,000 as a key resistance level.
- The reported RSI was 66.74, while the ADX was 18.15, indicating positive momentum but developing trend strength.
- Technical commentary cited targets above Rs 2,200 over the next three to four weeks, with supports at Rs 2,000 and Rs 1,960.
powered by IRIS
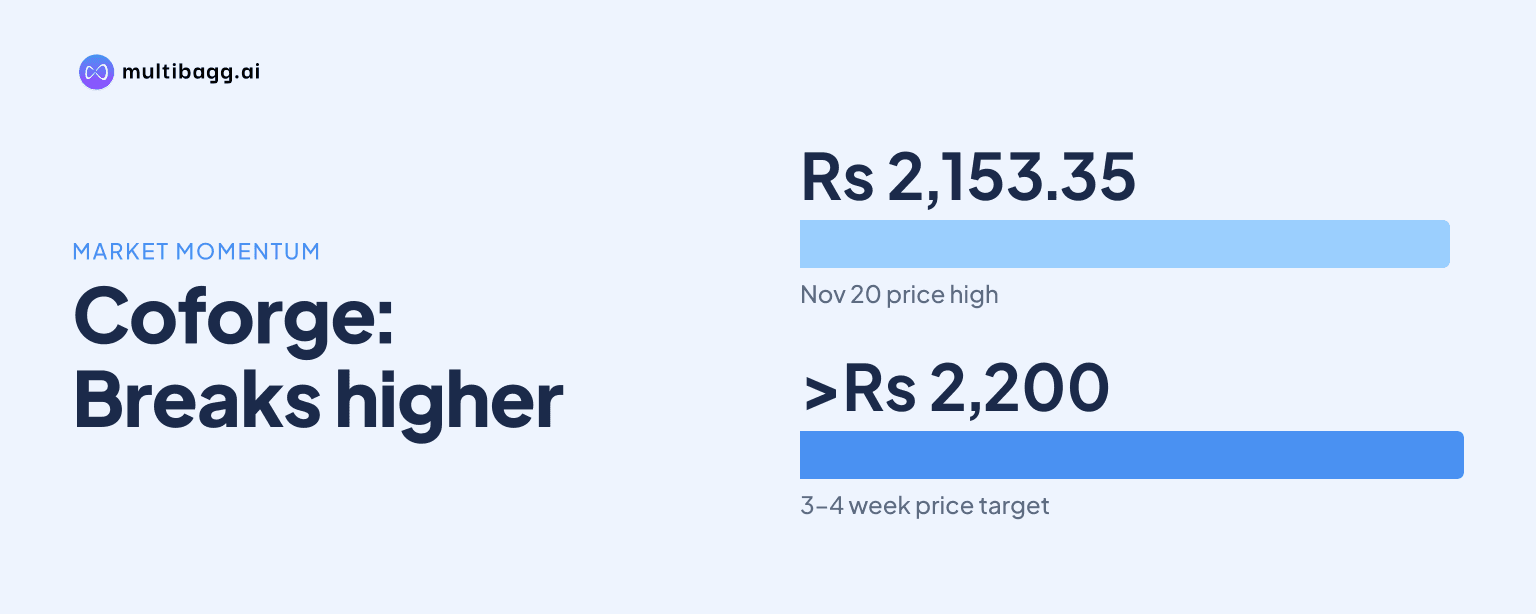
On 20 November 2026, Coforge Ltd broke out of a consolidation range that had lasted more than two months, rising 5.14% and touching a reported all-time high of Rs 2,153.35. The move took the IT services stock above earlier resistance near Rs 2,000, while it remained above major moving averages.
Why did Coforge break out of consolidation?
Coforge broke out after trading in a broad range from September 2026, with Rs 2,000 acting as a repeated resistance area and Rs 1,700 marking the lower end of the cited range. Social-media discussions and technical commentary described the move as a continuation of an existing momentum trend rather than a recovery rally.
The breakout followed renewed buying interest after a period of consolidation. Coforge had earlier risen 4.23% to close at Rs 2,045 in one session, and subsequently advanced 5.14% on 20 November. That latest rise exceeded the IT - Software sector's reported 2.18% gain and came while the Sensex was up 0.18% after a volatile session.
Some reports put the 20 November high at Rs 2,147.65, while another cited Rs 2,153.35 as the fresh 52-week and all-time high. Both figures indicate that Coforge moved decisively above the earlier Rs 2,000 resistance zone. Investors assessing the move should note the difference in reported intraday highs rather than treat the levels as interchangeable.
Which Coforge price levels matter now?
Coforge's immediate technical reference points are support around Rs 2,000 and Rs 1,960, followed by Rs 1,940 and the 20-day EMA near Rs 1,925. The former resistance area around Rs 2,000 is particularly important because a sustained hold above it would support the interpretation that the consolidation has ended.
Earlier technical commentary also identified Rs 2,060 to Rs 2,100 as a resistance zone before the latest record-high move. On the downside, a break below nearby supports could indicate a pause or consolidation following the sharp advance. A prior trading view used Rs 1,700 as a stop-loss level, which also coincided with the lower boundary of the September range.
Got a follow-up? Ask IRIS
What do Coforge's momentum indicators show?
Coforge's reported technical readings were broadly positive, with the share price above major moving averages and bullish MACD and Bollinger Band signals on weekly and monthly charts. Commentary also cited the stock's position above the 20 EMA at Rs 1,925, 50 EMA at Rs 1,855, 100 SMA at Rs 1,725 and 200 SMA at Rs 1,540.
The RSI was reported at 66.74, indicating stronger momentum without entering the traditional overbought zone. At the same time, the ADX was 18.15, suggesting that trend strength was still developing. That combination supports positive momentum but does not by itself establish that the advance will continue uninterrupted.
There are also cautionary signals in the available technical commentary. KST and Dow Theory readings were described as mildly bearish on the weekly timeframe, while another report noted mildly bearish KST readings on weekly and monthly charts. These indicators leave room for short-term volatility or a retest of breakout levels even as the broader setup remains positive.
What targets and risks are being discussed for Coforge?
Technical analysts cited potential targets above Rs 2,200 over the next three to four weeks, while a separate inverse head-and-shoulders view identified Rs 2,250 as a possible target. Another trading recommendation had set a Rs 2,100 target after suggesting a buy range of Rs 1,845 to Rs 1,855. These are analyst views based on chart patterns, not confirmed price outcomes.
The bullish case rests on a higher-high, higher-low structure from a March low near Rs 1,080, a rising trendline that reportedly supported earlier corrections, and the break above the consolidation ceiling. The stock's move above its key moving averages was also cited as evidence of a positive medium-term structure.
The principal risk is that the sharp move may not receive enough follow-through. Commentary specifically stressed the need for strong volume confirmation and cautioned against chasing the stock after a rapid upmove. A failure to hold nearby support, particularly around the former Rs 2,000 resistance area, would weaken the immediate breakout narrative.
Conclusion
Coforge has moved beyond a consolidation phase that lasted more than two months and has recorded a fresh high above Rs 2,147, with one report placing the intraday peak at Rs 2,153.35. Price action above major moving averages, a favourable RSI reading and bullish MACD and Bollinger Band signals support the positive trend, although weaker KST, Dow Theory and ADX readings argue for measured expectations.
The next test is whether Coforge can sustain trade above the Rs 2,000 breakout area while attracting sufficient volume. Traders tracking the setup will also watch supports at Rs 1,960, Rs 1,940 and Rs 1,925, alongside the cited technical targets above Rs 2,200 in the coming three to four weeks.