










Confidence Petroleum net debt-to-equity reaches 0.5x in H1 FY27
Key highlights
- Confidence's net debt-to-equity increased to 0.5x in H1 FY27 from 0.2x in FY26.
- Confidence's short-term borrowings rose Rs 480 crore to Rs 658 crore in H1 FY27.
- Confidence's trade payables increased Rs 520 crore to Rs 627 crore in H1 FY27.
- Confidence's H1 FY27 revenue rose 122% to Rs 4,644 crore and PAT rose 222% to Rs 132 crore.
powered by IRIS
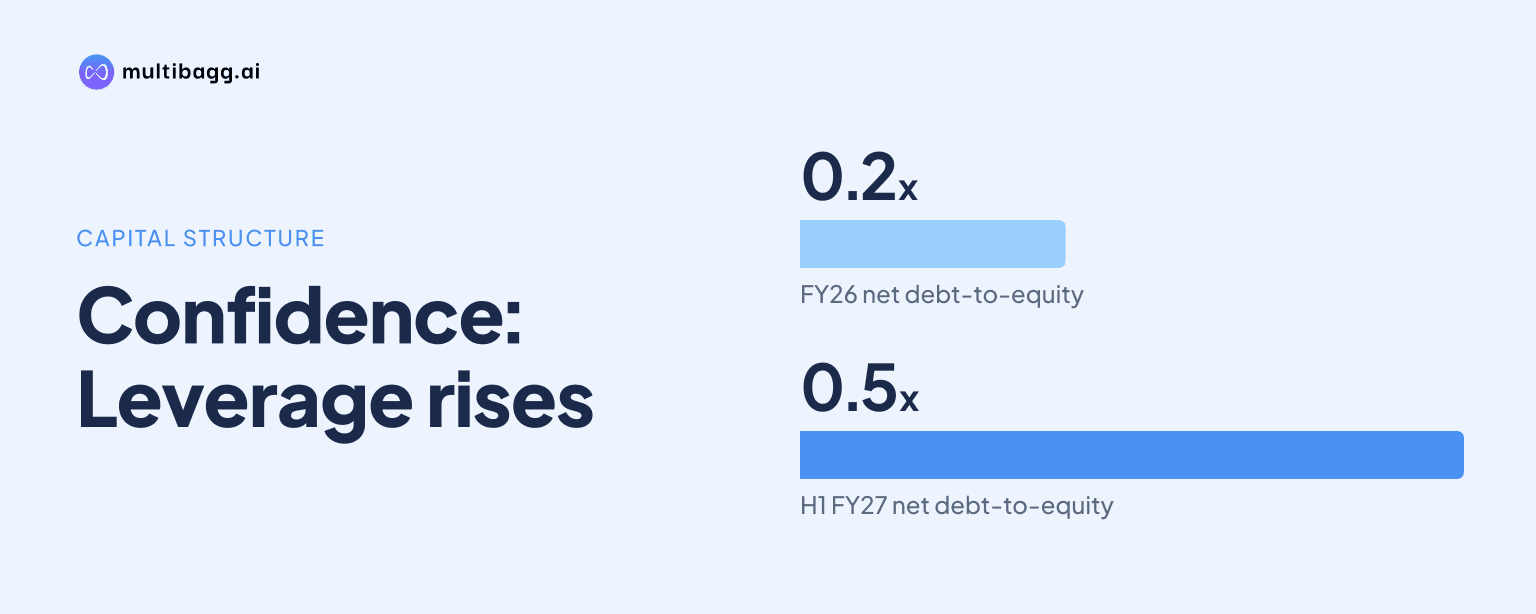
Confidence Petroleum reported net debt-to-equity of 0.5x in H1 FY27, up from 0.2x in FY26, as short-term borrowings rose Rs 480 crore to Rs 658 crore. Management attributed the increase in short-term borrowing to higher liquefied petroleum gas (LPG) imports from the USA amid Middle East supply disruptions.
Know Confidence Petroleum India inside out
Results, valuation, peers and who's buying, in one view.
Why did Confidence's net debt-to-equity rise in H1 FY27?
Confidence's net debt-to-equity rose to 0.5x in H1 FY27 because short-term borrowing increased during an LPG sourcing cycle that management linked to higher USA imports. The ratio was 0.2x in FY26 and 0.3x in FY25. It had previously stood at 0.1x in FY22 and FY24, while FY23 recorded 0.4x.
Confidence's short-term borrowings reached Rs 658 crore in H1 FY27, compared with Rs 178 crore in FY26. Non-current borrowings also increased to Rs 389 crore from Rs 325 crore, while net worth rose to Rs 1,675 crore from Rs 1,541 crore. The presentation attributes the short-term borrowing increase specifically to higher LPG imports from the USA amid supply disruptions in the Middle East.
The balance-sheet movement occurred despite an increase in reserves and surplus to Rs 1,518 crore in H1 FY27 from Rs 1,385 crore in FY26. Share capital was unchanged at Rs 33 crore, and minority interest increased by Rs 1 crore to Rs 124 crore. The reported 0.5x ratio therefore reflects a funding increase that outpaced the rise in net worth over the period.
How did Confidence's current liabilities change in H1 FY27?
Confidence's total current liabilities increased to Rs 1,746 crore in H1 FY27 from Rs 644 crore in FY26, led by higher trade payables and short-term borrowings. Trade payables rose Rs 520 crore to Rs 627 crore, while short-term borrowings increased Rs 480 crore to Rs 658 crore. Other financial liabilities also rose to Rs 295 crore from Rs 202 crore.
Confidence's current assets increased by Rs 1,283 crore to Rs 2,675 crore alongside the rise in current liabilities. Inventories rose to Rs 599 crore from Rs 209 crore, trade receivables increased to Rs 431 crore from Rs 219 crore, and other current assets grew to Rs 738 crore from Rs 449 crore. Cash and bank balances were Rs 227 crore, compared with Rs 223 crore at FY26.
Other current liabilities declined to Rs 55 crore in H1 FY27 from Rs 90 crore in FY26, partly offsetting the increases elsewhere. Other current tax liabilities rose to Rs 63 crore from Rs 27 crore, and lease liabilities increased to Rs 41 crore from Rs 36 crore. Total current liabilities consequently grew by Rs 1,102 crore, compared with the Rs 1,283 crore increase in current assets.
Did Confidence's earnings grow as funding needs rose?
Confidence's earnings grew in H1 FY27 as its funding requirement rose, with revenue from operations increasing 122% to Rs 4,644 crore from Rs 2,095 crore in H1 FY26. Earnings before interest, tax, depreciation and amortisation (EBITDA) increased 84% to Rs 304 crore from Rs 165 crore. Profit after tax (PAT) rose 222% to Rs 132 crore from Rs 41 crore.
Confidence's EBITDA margin declined to 6.6% in H1 FY27 from 7.9% in H1 FY26, although EBITDA increased by Rs 139 crore. PAT margin rose to 2.8% from 2.0% over the same comparison. The presentation reported H1 FY27 finance costs of Rs 52 crore, compared with Rs 84 crore for the full FY26.
In Q2 FY27, Confidence reported revenue from operations of Rs 2,235 crore, down 7% from Rs 2,409 crore in Q1 FY27 but up 127% from Rs 983 crore in Q2 FY26. Q2 EBITDA was Rs 161 crore, up 12% sequentially from Rs 144 crore, while PAT increased 11% to Rs 69 crore from Rs 63 crore. Finance costs were Rs 31 crore in Q2 FY27, versus Rs 21 crore in Q1 FY27 and Rs 24 crore in Q2 FY26.
Got a follow-up? Ask IRIS
What operating growth coincided with Confidence's higher borrowing?
Confidence's overall LPG sales volumes rose to 4.87 lakh metric tonnes in H1 FY27 from 4.13 lakh metric tonnes in H1 FY26. The increase of 0.74 lakh metric tonnes coincided with H1 FY27 revenue from operations of Rs 4,644 crore, close to the Rs 4,705 crore reported for the full FY26. The presentation links capacity building and infrastructure strengthening to higher volumes.
Confidence reported capital expenditure of Rs 114 crore in FY26, below Rs 272 crore in FY25 and Rs 245 crore in FY24. Property, plant and equipment increased to Rs 784 crore in H1 FY27 from Rs 769 crore in FY26. Capital work in progress rose to Rs 77 crore from Rs 28 crore, showing that investment in operating assets continued alongside higher current funding needs.
The longer historical comparison shows LPG sales volumes rose from 2.68 lakh metric tonnes in FY22 to 8.57 lakh metric tonnes in FY26. Revenue from operations increased from Rs 1,428 crore in FY22 to Rs 4,705 crore in FY26. EBITDA margin, however, moved from 13.0% in FY22 to 7.4% in FY26 and 6.6% in H1 FY27.
How did Confidence's broader balance sheet develop?
Confidence's total assets increased to Rs 4,035 crore in H1 FY27 from Rs 2,736 crore in FY26, matching total equity and liabilities at both reporting points. Total non-current assets rose by Rs 15 crore to Rs 1,360 crore, whereas total current assets increased by Rs 1,283 crore to Rs 2,675 crore. The larger part of the balance-sheet expansion was therefore in current assets.
Confidence's total non-current liabilities increased to Rs 615 crore from Rs 551 crore. Non-current borrowings rose to Rs 389 crore from Rs 325 crore, while lease liabilities were broadly unchanged at Rs 222 crore against Rs 223 crore. Total current liabilities of Rs 1,746 crore exceeded total non-current liabilities of Rs 615 crore in H1 FY27.
Return on capital employed, which measures earnings relative to capital employed, was 10% in H1 FY27, unchanged from FY26. Return on equity increased to 8% from 7%, while earnings per share rose to Rs 3.93 from Rs 2.60. These ratios were reported alongside the move in net debt-to-equity from 0.2x to 0.5x.
Conclusion
Confidence's H1 FY27 balance sheet reflects both higher LPG activity and a substantial increase in working-capital-related funding. Net debt-to-equity reached 0.5x, short-term borrowings rose to Rs 658 crore, and trade payables climbed to Rs 627 crore. At the same time, H1 revenue reached Rs 4,644 crore, PAT was Rs 132 crore, and LPG sales volumes increased to 4.87 lakh metric tonnes.
The next disclosure to watch is whether the import-related sourcing condition identified by management persists after H1 FY27. The presentation leaves unresolved how long higher USA LPG imports and Middle East supply disruptions will affect short-term borrowings, inventories of Rs 599 crore and trade payables of Rs 627 crore. Subsequent results can show whether these current balance-sheet levels change as sourcing conditions and volumes develop.