










Corona Remedies grew 2.1 times faster than Indian pharma
Key highlights
- CORONA’s revenue grew 16.9% versus 8.1% for IPM over MAT Sep-23 to MAT Sep-26, making it 2.1 times faster than the market.
- CORONA’s volume growth was 8.2%, compared with 2.5% for IPM, giving it a 3.3-times relative advantage.
- CORONA grew 22.5% in Q2FY27 versus 12.0% for IPM, maintaining its growth premium across volume, price and new introductions.
- CORONA’s acute-to-chronic portfolio mix shifted from 70:30 in FY13 to 28:72 in FY26, while specialists and super-specialists accounted for 67% of prescriptions in September 2026.
powered by IRIS
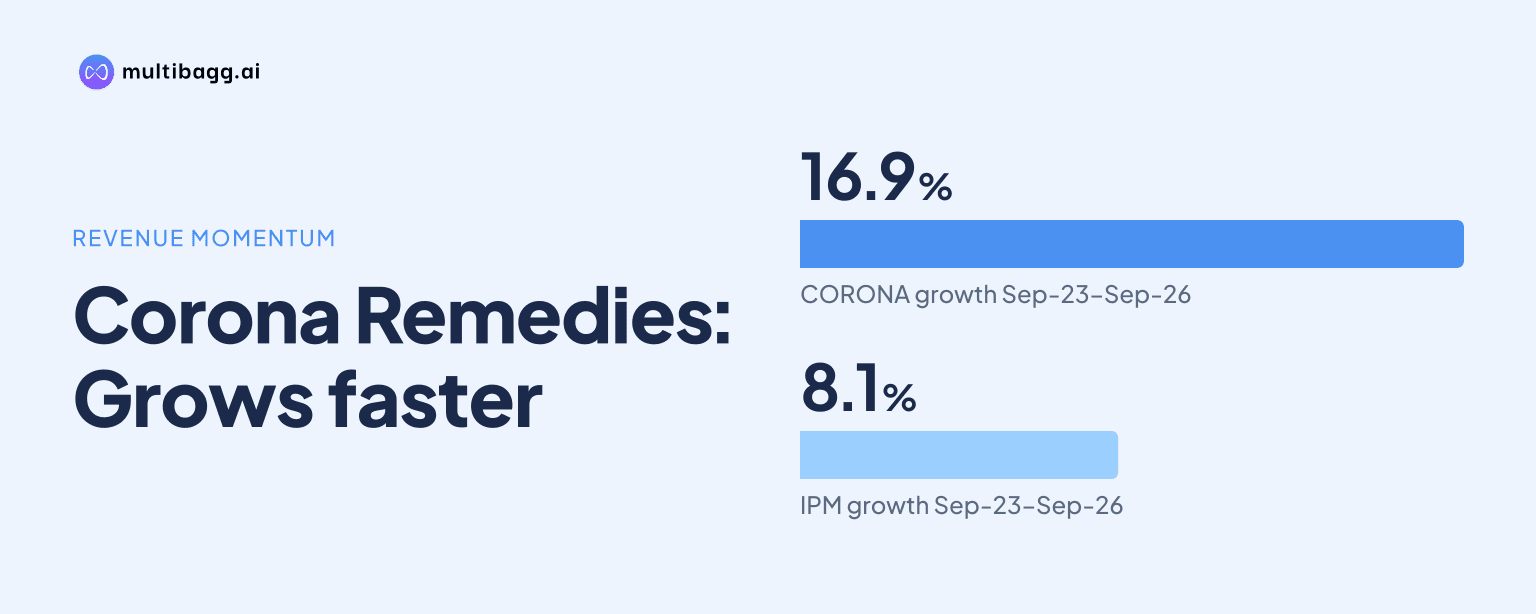
Corona Remedies grew 16.9% in the three years to moving annual total (MAT) September 2026, against 8.1% for the Indian Pharmaceutical Market (IPM), or 2.1 times the market rate. CORONA’s 8.2% volume growth, compared with 2.5% for IPM, was its largest relative growth advantage across volume, price and new introductions.
Know Corona Remedies inside out
Results, valuation, peers and who's buying, in one view.
Why did CORONA grow faster than the Indian pharmaceutical market?
CORONA outgrew IPM by 8.8 percentage points over MAT Sep-23 to MAT Sep-26, recording 16.9% total-revenue growth against 8.1% for the market, according to PharmaTrac. That comparison translates to a 2.1-times growth ratio. In Q2FY27, the gap remained wide: CORONA grew 22.5%, while IPM grew 12.0%, representing a 1.9-times ratio.
Volume was the clearest differentiator in the three-year comparison. CORONA reported 8.2% volume growth versus 2.5% for IPM, a 3.3-times ratio, compared with a 4.8% versus 3.8% comparison in price growth, or 1.2 times. New introductions grew 4.0% for CORONA and 1.8% for IPM, a 2.2-times ratio. The presentation shows volume as the largest relative advantage for CORONA among the reported growth measures.
Did CORONA maintain its growth premium in Q2FY27?
CORONA maintained a growth premium in Q2FY27 across all four reported measures, with total revenue up 22.5% against 12.0% for IPM. Its volume growth was 6.5%, compared with 2.3% for the market, a 2.9-times ratio. That was below the 3.3-times volume ratio reported over the three-year MAT period, but it remained the largest relative advantage among the three revenue drivers in the quarter.
Pricing and new introductions also exceeded market growth during Q2FY27. CORONA’s price growth was 8.9%, versus 6.1% for IPM, while new-introduction growth was 7.0%, versus 3.6%. Those comparisons equate to 1.5 times and 1.9 times, respectively. Total-revenue growth increased from 16.9% in the MAT Sep-23 to Sep-26 period to 22.5% in Q2FY27, while IPM growth rose from 8.1% to 12.0%.
The presentation places these results against an IPM forecast to expand at an 8% to 9% compound annual growth rate (CAGR) from FY25 to FY30P, after a 9% CAGR between FY20 and FY25. IPM value is shown rising from Rs 2.3 lakh crore in FY25 to Rs 3.1 lakh crore in FY30P. CRISIL Intelligence expects chronic therapies to grow at an 8.5% to 9.5% CAGR, above the 7.5% to 8.5% range for acute therapies.
Got a follow-up? Ask IRIS
Which therapies drove CORONA’s growth above IPM?
CORONA exceeded IPM growth in each of its four key therapies in the MAT Sep-23 to MAT Sep-26 period. Pain Management had the largest relative multiple, with CORONA growing 27.7% against 8.2% for IPM, or 3.4 times. Urology followed at 42.8% for CORONA against 13.7% for IPM, or 3.1 times, and it had the highest absolute growth percentage among the four therapies.
Women’s Healthcare grew 14.5% for CORONA, compared with 7.1% for IPM, a 2.0-times ratio. Cardio-Diabetes rose 22.0%, against IPM growth of 12.0%, or 1.8 times. Among the listed therapies, Women’s Healthcare had the largest MAT Sep-26 value at Rs 514.1 crore, followed by Cardio-Diabetes at Rs 456.2 crore. Pain Management recorded Rs 221.3 crore and Urology Rs 56.1 crore.
CORONA’s positions varied by therapy at MAT Sep-26 in its addressable markets. It ranked fifth in Women’s Healthcare, with 32 mother brands, and fifth in Pain Management, with five mother brands. Its Cardio-Diabetes rank was 19th across 19 mother brands, while Urology ranked 12th with eight. These rankings show that the highest growth rates did not simply correspond to the largest therapy values.
How does CORONA’s prescription focus support its therapy strategy?
CORONA’s prescription mix is more concentrated in specialist and super-specialist doctors than the IPM mix shown in the presentation. Specialists represented 55% of CORONA prescriptions in September 2026, compared with 35% for IPM. Super-specialists accounted for a further 12%, versus 8% for IPM, meaning these two groups represented 67% of CORONA prescriptions compared with 43% for IPM.
General practitioners, or GPs, made up 26% of CORONA prescriptions, below the IPM share of 39%. Other specialists accounted for 7% for CORONA and 18% for IPM; the company defines this category as therapies where it has limited presence. Management describes this specialist and super-specialist concentration as its middle-of-the-pyramid approach, focused on urban and semi-urban markets with higher prescription growth.
The approach sits alongside a portfolio shift toward chronic and sub-chronic therapies. CORONA says its acute-to-chronic portfolio mix changed from 70:30 in FY13 to 28:72 in FY26. This change aligns with the external market forecast, which puts the chronic share of IPM at 57% to 59% by FY30P, up from 55% in FY25, while the acute share is projected at 41% to 43%.
Conclusion
CORONA’s reported 16.9% growth over MAT Sep-23 to MAT Sep-26 exceeded IPM’s 8.1% rate through higher volume, price and new-introduction growth, with volume showing the widest relative gap at 3.3 times. The growth premium extended across Women’s Healthcare, Cardio-Diabetes, Pain Management and Urology, although the scale and market rank of those therapies differed materially.
The next measure to watch is whether CORONA sustains growth as IPM moves toward its projected Rs 3.1 lakh crore FY30P value and chronic therapies rise to 57% to 59% of the market. CORONA’s FY13-to-FY26 acute-to-chronic mix shift to 28:72 and its 67% prescription contribution from specialists and super-specialists provide the disclosed operating context for that comparison.