










Creative Graphics Solutions India H1 profit drops 40% despite growth
Key highlights
- H1 FY27 revenue from operations rose 32.6% year on year to ₹233.3 crore.
- H1 FY27 net profit declined 40.2% year on year to ₹7.3 crore.
- EBITDA margin fell 358 basis points year on year to 8.3%.
- Pharma packaging capacity increased to 44,000 MTPA, with full capacity available from October 2026.
powered by IRIS
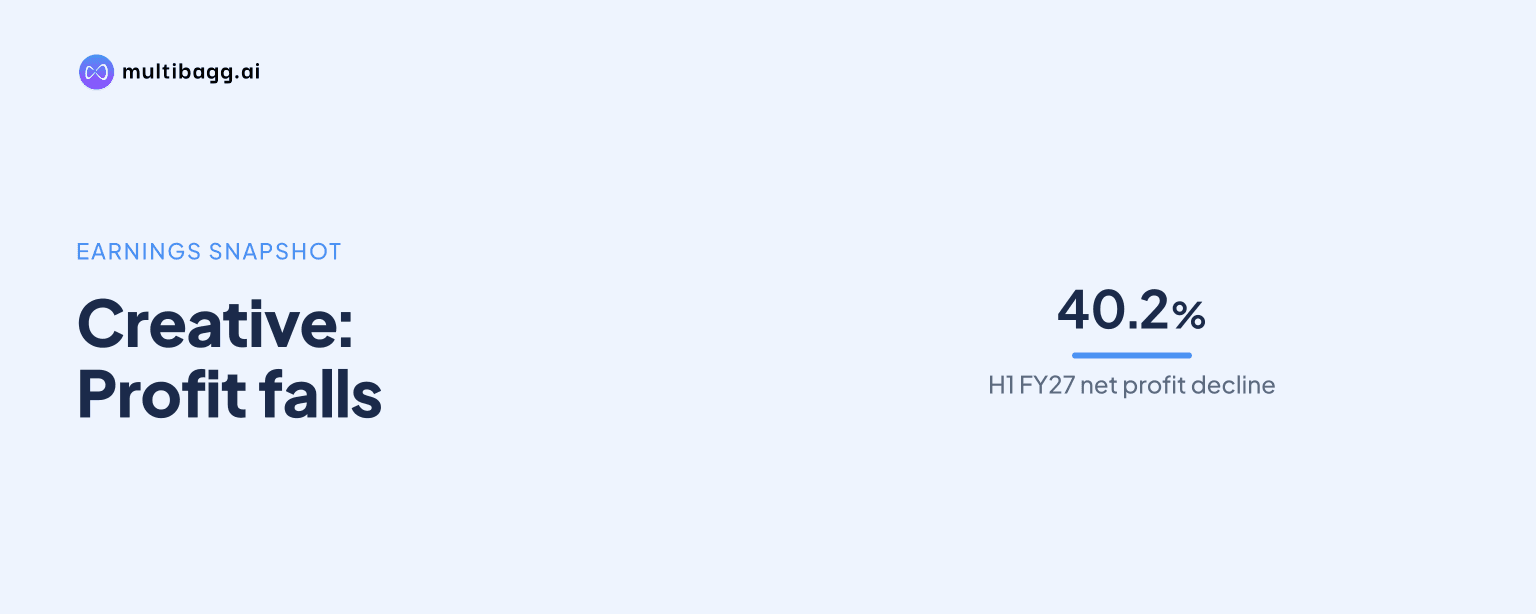
Creative Graphics Solutions India Limited reported H1 FY27 net profit of ₹7.3 crore, down 40.2% year on year, even as revenue from operations rose 32.6% to ₹233.3 crore. The contrast reflects margin pressure during the company’s capacity ramp-up and its expansion into pharmaceutical packaging.
Know Creative Graphics Solutions India inside out
Results, valuation, peers and who's buying, in one view.
What did Creative Graphics report for H1 FY27?
Creative Graphics reported consolidated revenue from operations of ₹233.3 crore for the half year ended September 30, 2026, compared with ₹175.9 crore in H1 FY26. Total income was also ₹233.3 crore, as other income was limited to ₹0.1 crore during the period.
Net profit fell to ₹7.3 crore from ₹12.2 crore a year earlier. Profit before exceptional items and tax declined to ₹10.1 crore from ₹16.4 crore. The reported results were approved by the board on November 14, 2026, along with the unaudited standalone and consolidated financial statements and limited review reports.
The company’s investor presentation attributed the revenue increase to its transition from a flexographic plate-focused business towards a broader pharmaceutical packaging portfolio. It cited recurring demand linked to medicine production batches and new product designs, while stating that client retention exceeded 95%.
Why did Creative Graphics' margins decline despite higher revenue?
Creative Graphics said EBITDA margin declined to 8.3% in H1 FY27 from 11.9% in H1 FY26 because of costs associated with ramping up newly expanded capacity. EBITDA fell 7.2% year on year to ₹19.5 crore, despite the substantial rise in revenue.
The company also reported that the Middle East conflict disrupted supply chains for imported materials, including aluminium, PVC and PVDC. These disruptions affected plant ramp-ups and had an impact during the first quarter of FY27. The presentation described the margin pressure as temporary and linked its expected recovery to operating leverage as utilisation improves.
On a half-on-half basis, revenue increased from ₹170.1 crore in H2 FY26 to ₹233.3 crore in H1 FY27. EBITDA margin improved from 7.1% in the preceding half year, but remained below the 11.9% recorded in H1 FY26. Net profit was higher than ₹6.6 crore reported for H2 FY26, although it remained below the prior-year half-year figure.
The figures show that the expansion lifted sales faster than reported earnings. For investors, the key operating issue is whether higher production volumes from the new facilities can absorb the initial fixed and ramp-up costs without further supply-chain disruptions.
Got a follow-up? Ask IRIS
How has Creative Graphics expanded its pharmaceutical packaging capacity?
Creative Graphics expanded pharmaceutical packaging capacity from 8,000 metric tonnes per annum in FY25 to 44,000 metric tonnes per annum after completing its capex programme. As of September 30, 2026, 32,000 metric tonnes per annum was in commercial production, with the full 44,000 metric tonnes per annum available from October 2026.
A new 12,000-tonne Alu Alu line began commercial production in October 2026. Earlier, in May 2026, the company had said the line was expected to start commercial production within the first half of FY27. Alu Alu packaging is used in pharmaceutical blister packaging, making the new line relevant to the company’s effort to increase its presence in the pharma packaging segment.
Management has stated that all planned capex is complete. It has also identified exports as a growth avenue, with a target for exports to contribute 25% of pharmaceutical revenue. Export revenue reached ₹12.0 crore in H1 FY27, exceeding the ₹8.1 crore reported for the full year FY26.
What did the subsidiaries and auditor's review show?
Creative Graphics' two subsidiaries, Wahren India and Creative Graphics Premedia, contributed combined revenue of ₹172.02 crore in H1 FY27. Their combined net profit was ₹1.75 crore and their net assets stood at ₹15.74 crore at the reported period end.
The limited review report included qualifications relating to the non-provision of gratuity and leave-encashment liabilities under Ind AS 19, as well as unidentified MSME creditors. These are points disclosed in the review report and form part of the financial-reporting context for investors assessing the consolidated results.
The subsidiary revenue contribution indicates the significance of the group structure in Creative Graphics' business volume. However, the reported consolidated net profit of ₹7.3 crore shows that higher group revenue did not translate into equivalent earnings growth during the half year, as margins were affected by the ongoing operational ramp-up.
Why do these results matter for investors?
Creative Graphics' H1 FY27 results combine strong top-line expansion with a marked decline in profitability. Revenue growth of 32.6% and export revenue of ₹12.0 crore indicate that the expanded pharmaceutical packaging operations are adding volume. At the same time, the 358-basis-point EBITDA-margin contraction and the 40.2% fall in net profit show the cost of bringing new capacity into commercial production.
The completed capex changes the company’s operating profile because it now has 44,000 metric tonnes per annum of pharmaceutical packaging capacity. The financial benefit from that capacity will depend on production utilisation, procurement conditions for imported inputs and the company’s ability to sell increased output across domestic and export markets. No earnings-call transcript was available with these results, so the disclosed presentation and financial filings remain the stated basis for these observations.
Conclusion
Creative Graphics delivered H1 FY27 revenue of ₹233.3 crore, but net profit fell to ₹7.3 crore as capacity ramp-up expenses and supply-chain disruption weighed on margins. The results place the focus on execution of the pharmaceutical packaging expansion rather than on revenue growth alone.
Investors will watch the operational contribution from the 12,000-tonne Alu Alu line, utilisation of the full 44,000 MTPA packaging capacity available from October 2026, and progress towards the company’s target of deriving 25% of pharmaceutical revenue from exports.