










Creative Graphics H1 FY27 revenue rose 33%, PAT fell 40%
Key highlights
- Creative Graphics reported H1 FY27 revenue of Rs 233.3 crore, up 32.6% year on year.
- Creative Graphics' H1 FY27 PAT fell 40.4% year on year to Rs 7.3 crore.
- Creative Graphics' EBITDA margin was 8.3% in H1 FY27, versus 11.9% in H1 FY26.
- Creative Graphics recorded Rs 12.0 crore of exports in H1 FY27, above Rs 8.1 crore in full-year FY26.
powered by IRIS
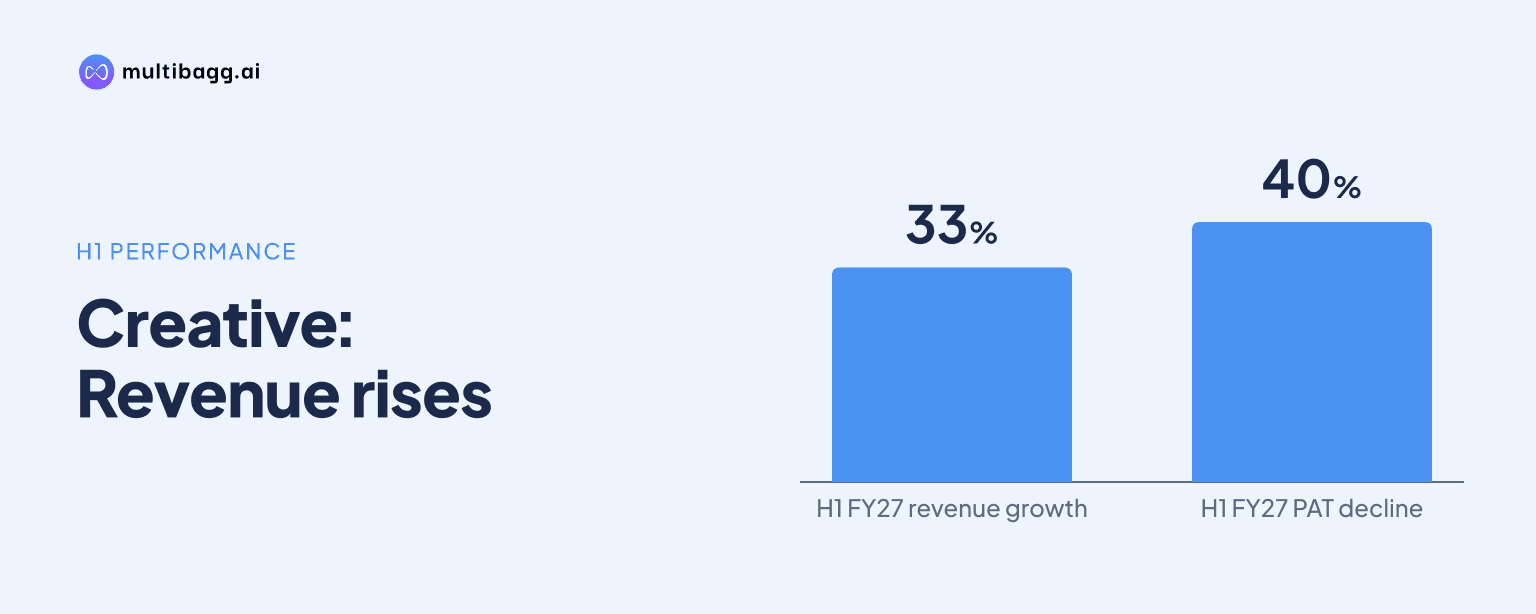
Creative Graphics reported H1 FY27 revenue of Rs 233.3 crore, up 32.6% year on year, while profit after tax, or PAT, fell 40.4% to Rs 7.3 crore. EBITDA declined 7.2% to Rs 19.5 crore as new capacity carried fixed costs ahead of volumes and supply-chain disruption affected operations.
Know Creative Graphics Solutions India inside out
Results, valuation, peers and who's buying, in one view.
Why did Creative Graphics' H1 FY27 profit fall?
Creative Graphics' profit fell because operating costs, depreciation and finance costs rose faster than earnings in H1 FY27. Revenue from operations increased by Rs 57.4 crore from Rs 175.9 crore in H1 FY26 to Rs 233.3 crore, while PAT decreased by Rs 4.9 crore from Rs 12.2 crore to Rs 7.3 crore. PAT margin narrowed to 3.1% from 6.9%.
Cost of materials consumed rose 36.5% to Rs 175.1 crore, faster than the 32.6% rise in revenue, and gross margin declined by 214 basis points, or bps, to 24.9% from 27.1%. Employee benefits expense increased 41.7% to Rs 18.1 crore and other expenses rose 48.5% to Rs 20.6 crore as new facilities were staffed and operated ahead of their full revenue contribution.
Depreciation and amortisation increased 60.9% to Rs 4.1 crore from Rs 2.6 crore, while finance costs rose 77.6% to Rs 5.3 crore from Rs 3.0 crore. Other income reduced to Rs 0.1 crore from Rs 1.0 crore, taking profit before tax down 38.5% to Rs 10.1 crore despite a lower tax expense of Rs 2.8 crore versus Rs 4.2 crore.
Creative Graphics said the Middle East conflict disrupted the supply of imported aluminium, PVC and PVDC materials. The disruption delayed the ramp-up of PVC/PVDC and Tandem lines, while the Alu Alu business was affected in Q1 FY27 before a recovery in Q2 FY27.
How did Creative Graphics' margins change in H1 FY27?
Creative Graphics' EBITDA margin improved from H2 FY26 but remained below H1 FY26. Earnings before interest, tax, depreciation and amortisation, or EBITDA, margin was 8.3% in H1 FY27, compared with 7.3% in H2 FY26 and 11.9% in H1 FY26.
Revenue was Rs 63.2 crore higher than H2 FY26, a 37.1% increase, while EBITDA rose 56.6% from Rs 12.4 crore to Rs 19.5 crore. Gross margin also rose 142 bps sequentially from 23.5% to 24.9%, indicating an improvement from the preceding half despite the lower year-on-year margin.
PAT margin nevertheless fell by 74 bps from 3.9% in H2 FY26 to 3.1% in H1 FY27. Depreciation rose from Rs 2.9 crore to Rs 4.1 crore, finance costs increased from Rs 3.7 crore to Rs 5.3 crore, and tax expense rose from Rs 1.2 crore to Rs 2.8 crore over the same comparison.
The result therefore differed by comparison period. EBITDA of Rs 19.5 crore was above Rs 12.4 crore in H2 FY26, but below Rs 21.0 crore in H1 FY26 even though H1 FY27 revenue exceeded the prior-year period by Rs 57.4 crore. Management attributed the year-on-year difference to new-capacity fixed costs and supply-chain disruption.
Got a follow-up? Ask IRIS
Which new capacity affected Creative Graphics' costs?
Creative Graphics had completed planned capital expenditure and installed 44,000 metric tonnes per annum, or MTPA, of pharmaceutical-packaging capacity, but the lines were still ramping during H1 FY27. The total comprises 8,000 MT of existing Alu Alu capacity and 12,000 MT each of PVC/PVDC, Tandem extrusion and new Alu Alu capacity.
The 12,000 MT PVC/PVDC coating line had been in commercial production since H2 FY26, and the 12,000 MT Tandem extrusion line began commercial production in April 2026. The new 12,000 MT Alu Alu line completed trials in August 2026 and began commercial production in October 2026, according to Creative Graphics.
Creative Graphics said all three new pharma lines were in production from October 2026. The stated operating plan is to raise utilisation of the 44,000 MTPA pharma capacity, spreading fixed costs across more output as volumes build.
The Bengaluru flexo plant also completed its first full half-year in H1 FY27 after opening in August 2025. The plant serves the Bengaluru, Mangaluru and Coimbatore packaging corridor, while the installed Oman plant had not started commercially because of war-related supply-chain and manpower challenges.
Management's response to raw-material disruption includes a more structured buffer stock of key imported materials and periodic price revisions designed to pass through part of input-cost changes. Both the Bengaluru and Oman flexo plants were built and installed, with no further spending planned.
What did exports and working capital add to Creative Graphics' H1 FY27 picture?
Creative Graphics recorded exports of Rs 12.0 crore in H1 FY27, equal to 5.2% of revenue and above the Rs 8.1 crore reported for full-year FY26. Pharmaceutical-packaging exports were Rs 8.3 crore in H1 FY27 after the first export order in February 2026.
Management said it was in discussion with customers in 11 countries for pharma-packaging exports and was targeting exports of about 25% of pharma-packaging revenue. Export factoring, introduced in H1 FY27, is intended to fund export receivables soon after shipment.
Creative Graphics attended five industry events in H1 FY27 across India, Jordan, Egypt and Nigeria. The company had participated in 11 events across seven countries during FY26, while its H1 FY27 outreach included two technical presentations and activity across two continents.
Trade receivables rose by Rs 59.1 crore to Rs 173.3 crore at September 2026 from Rs 114.2 crore at March 2026, and inventories increased by Rs 17.8 crore to Rs 73.5 crore. Creative Graphics said borrowings increased by Rs 37.4 crore in H1 FY27, all through short-term borrowings, to fund higher receivables and inventory.
Net worth increased by Rs 7.3 crore to Rs 132.8 crore at September 2026 through retained profit, with no new equity issued. Working-capital limits stood at Rs 200 crore, including Rs 60 crore from Citibank, and CARE Ratings assigned a CARE BBB; Stable issuer rating on 12 October 2026.
Conclusion
Creative Graphics combined 32.6% H1 FY27 revenue growth with a 40.4% decline in PAT because materials, employee and other expenses rose faster than sales, while depreciation and finance costs increased. The sequential EBITDA recovery to Rs 19.5 crore from Rs 12.4 crore in H2 FY26 did not prevent PAT margin from falling to 3.1% from 3.9%.
The next measures to watch are utilisation of the 44,000 MTPA pharma capacity, the commercial start of the installed Oman flexo plant, and progress toward management's target of about 25% of pharma-packaging revenue from exports. Creative Graphics also plans buffer inventory, periodic price revisions and export factoring, mechanisms that may affect material availability, receivables and short-term borrowings of Rs 114.5 crore at September 2026.