










Creative Graphics: Bengaluru Lifted Revenue as Margins Fell
Key highlights
- Creative Graphics’ standalone revenue rose 17.3% year on year to ₹79.3 crore in H1 FY27.
- Standalone EBITDA margin was 12.5% in H1 FY27, versus 18.6% in H1 FY26.
- Bengaluru opened in August 2025 and completed its first full half-year in H1 FY27.
- Oman was installed in FY26, but commercial operations remained pending in H1 FY27.
powered by IRIS
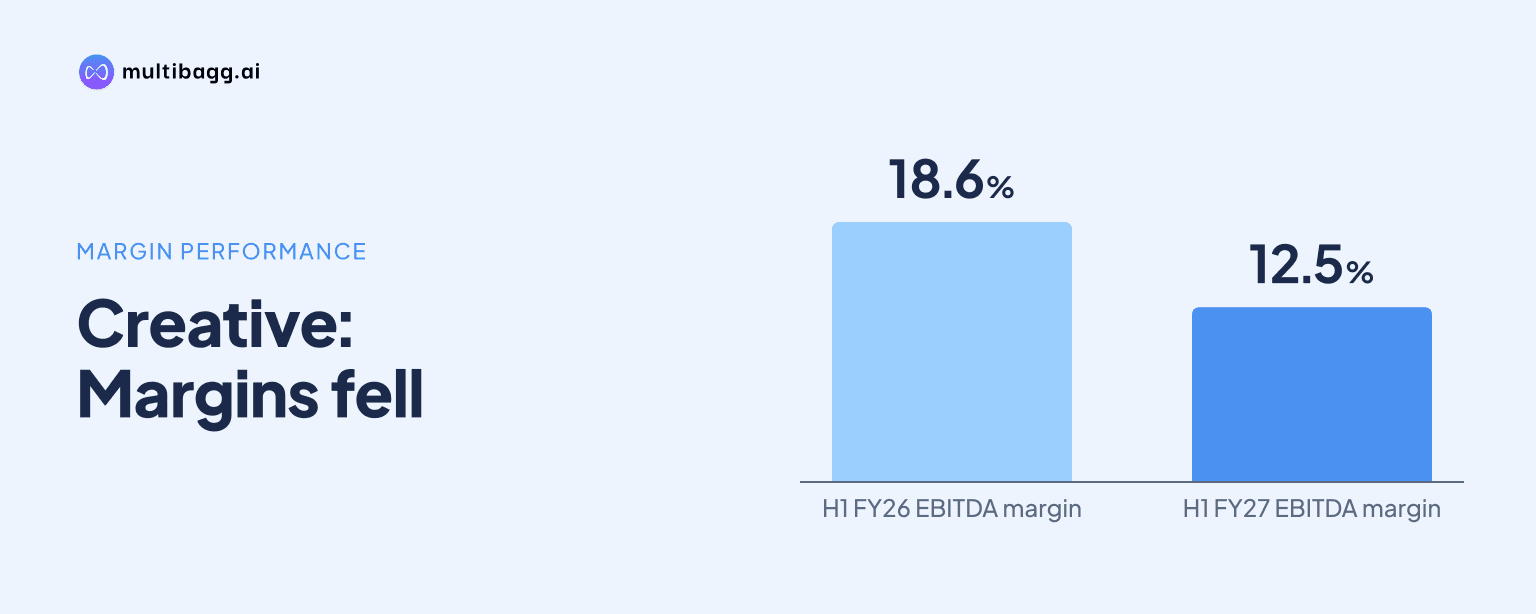
Creative Graphics Solutions India Limited increased standalone revenue 17.3% year on year to ₹79.3 crore in the first half (H1) of financial year (FY) 2027, helped by Bengaluru’s first full half-year, but its earnings before interest, tax, depreciation and amortisation (EBITDA) margin fell to 12.5% from 18.6% as Bengaluru and Oman carried costs ahead of volumes.
Know Creative Graphics Solutions India inside out
Results, valuation, peers and who's buying, in one view.
How much did Bengaluru contribute to Creative Graphics revenue?
Bengaluru helped Creative Graphics lift standalone revenue to ₹79.3 crore in H1 FY27 from ₹67.6 crore in H1 FY26. The plant opened in August 2025 and completed its first full half-year in H1 FY27, which Creative Graphics identified as a principal driver of the 17.3% year-on-year increase. The presentation does not disclose Bengaluru’s individual revenue, output or customer count.
The facility serves the Bengaluru, Mangaluru and Coimbatore packaging corridor, putting plate-making nearer to converters in South India. It forms part of Creative Graphics’ network of nine flexography plants, with eight in India and one in Oman. Kolkata is a joint-venture facility and is excluded from those plant counts.
Revenue was nevertheless lower than the ₹87.2 crore reported in H2 FY26, a sequential decrease of ₹7.9 crore. The comparison indicates that Bengaluru supported year-on-year growth, while total standalone sales in H1 FY27 did not match the immediately preceding half-year.
Why did Creative Graphics’ standalone margin decline?
Creative Graphics’ standalone EBITDA fell to ₹9.9 crore in H1 FY27 from ₹12.6 crore a year earlier because Bengaluru and Oman carried staffing and fixed costs before their volumes were fully established. The EBITDA margin consequently declined by 6.1 percentage points to 12.5%, despite the ₹11.7 crore increase in standalone revenue.
The H1 FY27 margin was 1 percentage point above the 11.5% reported in H2 FY26, but remained below the 18.6% of H1 FY26. This sequential improvement coincided with lower standalone revenue than H2 FY26, while the year-on-year comparison shows that operating costs at the newer sites rose faster than the sales benefit during the reported period.
Profit after tax (PAT) also declined, to ₹5.5 crore in H1 FY27 from ₹7.7 crore in H1 FY26. At the consolidated level, employee benefits expense rose 41.7% to ₹18.1 crore and other expenses increased 48.5% to ₹20.6 crore, which management attributed in part to staffing and operating new plants and lines ahead of revenue.
What is the status of Creative Graphics’ Oman plant?
Creative Graphics’ Oman plant was installed in FY26 but had not started commercial operations by H1 FY27. Management said war-related supply-chain and manpower challenges delayed the facility, which is Creative Graphics’ first plant outside India and is intended to serve packaging converters in Gulf and African markets.
Unlike Bengaluru, Oman had no disclosed commercial sales contribution in H1 FY27. Both sites were built and installed, and Creative Graphics said no further spending was planned for either plant. The remaining requirement is therefore a commercial start in Oman and higher operating volumes at both locations rather than further construction.
The Middle East conflict also disrupted imported-material supply chains for Creative Graphics’ pharmaceutical packaging operations. Management said this delayed the ramp-up of PVC/PVDC and Tandem lines, while the Alu Alu business was affected in the first quarter before a reported recovery in the second quarter of FY27.
Got a follow-up? Ask IRIS
How does the flexography ramp-up compare with group performance?
Creative Graphics’ consolidated revenue rose 32.6% year on year to ₹233.3 crore in H1 FY27, faster than the 17.3% rise in standalone revenue, but consolidated EBITDA fell 7.2% to ₹19.5 crore. The consolidated EBITDA margin was 8.3%, below 11.9% in H1 FY26 but above 7.3% in H2 FY26.
The group had completed planned capital expenditure and installed 44,000 metric tonnes per annum (MTPA) of pharmaceutical packaging capacity by H1 FY27. A new 12,000-tonne Alu Alu line completed trials in August 2026 and began commercial production in October 2026, after the reported half-year; the 12,000-tonne Tandem extrusion line had been in commercial production since April 2026.
Consolidated PAT declined 40.4% to ₹7.3 crore in H1 FY27 as depreciation and amortisation rose 60.9% to ₹4.1 crore and finance costs increased 77.6% to ₹5.3 crore. At September 2026, short-term borrowings were ₹114.5 crore, compared with ₹62.0 crore at March 2026, funding higher receivables and inventory as revenue expanded.
What must happen for the new sites to contribute more fully?
Creative Graphics needs Bengaluru volumes to rise and Oman to begin commercial production for the fixed costs of the two flexography sites to be spread across more sales. Management’s stated geographical expansion plan places Bengaluru in southern packaging markets and Oman at an entry point to the Middle East and Africa.
Management also plans to raise utilisation across 44,000 MTPA of pharmaceutical packaging capacity and grow exports towards about 25% of pharmaceutical packaging revenue. Pharmaceutical packaging exports reached ₹12.0 crore in H1 FY27, exceeding the ₹8.1 crore recorded in all of FY26, and Creative Graphics said it was discussing business with customers in 11 countries.
Existing customer reach provides the base for that plan, although the presentation gives no volume target for either flexography site. Creative Graphics reported more than 4,000 active flexography clients across more than 12 countries, while its pharmaceutical packaging business had more than 400 customers in H1 FY27.
Conclusion
The reported numbers show the near-term cost of Creative Graphics’ geographical expansion: Bengaluru added to standalone sales, but the cost base of Bengaluru and not-yet-operational Oman reduced year-on-year EBITDA and PAT. Group profitability was also affected by new pharmaceutical capacity, supply-chain disruption and higher depreciation and finance costs.
The next disclosed markers are Oman’s commercial launch, the pace of Bengaluru volume growth and utilisation of 44,000 MTPA of pharmaceutical capacity. Management’s export aim of about 25% of pharmaceutical packaging revenue, following ₹12.0 crore of such exports in H1 FY27 and the October 2026 Alu Alu line start, is another measure to watch.