










Creative Graphics H1 revenue rises 32.6% while PAT falls
Key highlights
- Creative Graphics reported H1 FY27 consolidated revenue of Rs 233.3 crore, up 32.6% year on year.
- Creative Graphics' H1 FY27 PAT declined 40.4% year on year to Rs 7.3 crore.
- Creative Graphics' EBITDA margin fell to 8.3% in H1 FY27 from 11.9% in H1 FY26.
- Creative Graphics reported net debt of Rs 119.7 crore at 30 September 2026, versus Rs 82.7 crore at 31 March 2026.
powered by IRIS
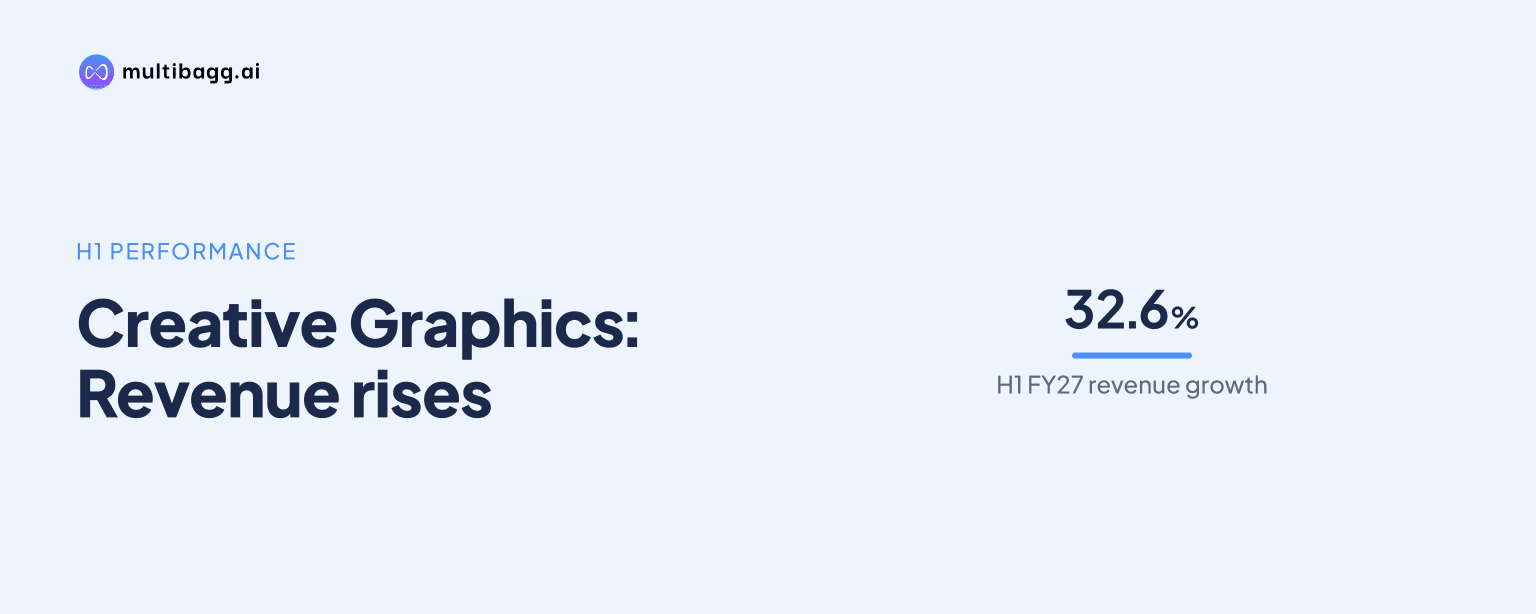
Creative Graphics Solutions India Limited reported consolidated revenue of Rs 233.3 crore for H1 FY27, up 32.6% year on year, while profit after tax fell 40.4% to Rs 7.3 crore as its PAT margin declined to 3.1% from 6.9%. The half-year ended 30 September 2026.
Know Creative Graphics Solutions India inside out
Results, valuation, peers and who's buying, in one view.
Why did Creative Graphics revenue increase in H1 FY27?
Creative Graphics increased consolidated revenue from operations by Rs 57.4 crore to Rs 233.3 crore in H1 FY27 from Rs 175.9 crore in H1 FY26. Management said this was the first full half-year in which the PVC/PVDC and Tandem lines were in production, with its focus remaining on sales and capacity utilisation at those facilities.
Revenue was also 37.1% above the Rs 170.1 crore reported in H2 FY26. The PVC/PVDC line at Wahren had been commercialised toward the end of H2 FY26, while the Tandem line was commercialised in April 2026, meaning both lines operated through the H1 FY27 reporting period.
Standalone revenue rose 17.3% to Rs 79.3 crore in H1 FY27 from Rs 67.6 crore in H1 FY26, compared with the consolidated increase of 32.6%. Creative Graphics reported standalone revenue of Rs 154.8 crore for FY26, while consolidated FY26 revenue was Rs 346.0 crore.
Why did Creative Graphics profit fall despite revenue growth?
Creative Graphics reported consolidated earnings before interest, tax, depreciation and amortisation, or EBITDA, of Rs 19.5 crore in H1 FY27, down 7.2% from Rs 21.0 crore a year earlier. EBITDA margin fell by 358 basis points to 8.3% from 11.9%, with management saying new capacity carried fixed costs ahead of volumes.
Profit after tax, or PAT, declined by Rs 4.9 crore to Rs 7.3 crore from Rs 12.2 crore in H1 FY26. PAT margin decreased by 382 basis points to 3.1% from 6.9%, while earnings per share fell 40.4% to Rs 3.00 from Rs 5.03.
The comparison with H2 FY26 was different: EBITDA increased 56.6% from Rs 12.4 crore to Rs 19.5 crore and its margin rose from 7.3% to 8.3%. PAT rose 11.0% from Rs 6.6 crore, although PAT margin fell from 3.9% to 3.1%, showing higher absolute profit sequentially but lower net profitability relative to revenue.
Standalone EBITDA fell 21.5% to Rs 9.9 crore in H1 FY27 from Rs 12.6 crore in H1 FY26, and standalone EBITDA margin declined to 12.5% from 18.6%. Standalone PAT decreased 28.9% to Rs 5.5 crore from Rs 7.7 crore over the same period.
What capacity has Creative Graphics added?
Creative Graphics started commercial production at its 12,000 metric tonne Alu Alu line in October 2026, after trials were completed in August 2026. Management said this brought all 44,000 metric tonnes per annum, or MTPA, of its pharmaceutical capacity into production.
The October 2026 start occurred after the 30 September 2026 end of H1 FY27, so the reported half-year does not include commercial production from the new Alu Alu line. Management said its plan is to fill the 44,000 MTPA capacity through customer approvals, new formats and exports.
Creative Graphics said its Bengaluru flexographic plates factory was ramping up as of November 2026. Its Oman factory had been installed but had not started commercial production because of war-related delays, with no commencement date provided in the release.
The company participated in five exhibitions in H1 FY27, including three international events in Jordan, Egypt and Nigeria and two domestic events in Mumbai and Hyderabad. Export shipments were under way as of November 2026, following the first export order in February 2026, although the release did not disclose export revenue or shipment volumes.
Got a follow-up? Ask IRIS
How did Creative Graphics debt and funding change?
Creative Graphics reported net debt of Rs 119.7 crore at 30 September 2026, up Rs 37.0 crore from Rs 82.7 crore at 31 March 2026. The release did not provide interest expense, debt maturities, debt-to-EBITDA or operating cash-flow figures for the period.
Management said working-capital limits had been enhanced, Citi had been added as a second banker, and Creative Graphics had entered its first invoice bill-discounting relationship. It also said export factoring had been introduced to fund export receivables soon after shipment, while all debtors continued to be insured.
CARE Ratings assigned Creative Graphics a CARE BBB; Stable long-term issuer rating on 12 October 2026. The announcement does not state the amount of receivables covered by insurance, the value of factoring used, or the borrowing cost associated with the Rs 119.7 crore net debt.
What is Creative Graphics planning for H2 FY27?
Creative Graphics said its H2 FY27 priorities are commercial production from the new Alu Alu line and in Oman, conversion of customer approvals into regular supply, export growth and working-capital discipline. These are management plans, and the release did not provide revenue, margin, profit or capacity-utilisation targets.
The 12,000 metric tonne Alu Alu line began commercial production in October 2026, while the Oman plant remained pending as of November 2026. The next financial update will show whether commercial activity from the Alu Alu line, along with approvals and exports, contributes to higher utilisation of the 44,000 MTPA pharmaceutical capacity.
Creative Graphics said its export pipeline continued to build, but did not provide an updated order volume in November 2026. In May 2026, it had said more than 100 metric tonnes of export orders were in the pipeline; the later update confirmed shipments were under way without quantifying the pipeline.
Conclusion
Creative Graphics delivered Rs 233.3 crore of consolidated revenue in H1 FY27, supported by a full reporting period from the PVC/PVDC and Tandem lines, but earnings did not follow the same direction. Year on year, EBITDA fell 7.2% to Rs 19.5 crore and PAT declined 40.4% to Rs 7.3 crore as EBITDA and PAT margins decreased to 8.3% and 3.1%, respectively.
The next items to watch are management's H2 FY27 plan for regular Alu Alu production, an Oman commercial start, customer approvals, export shipments and working-capital discipline. The new 12,000 metric tonne Alu Alu line started in October 2026, while net debt stood at Rs 119.7 crore on 30 September 2026 and the Oman start remained unresolved as of November 2026.