










Creative Graphics added Rs 37.4 crore in short-term debt in H1
Key highlights
- Creative Graphics said receivables rose Rs 59.2 crore and inventories rose Rs 17.8 crore in H1 FY27.
- Creative Graphics reported Rs 114.5 crore of short-term borrowings at September 2026, versus Rs 62.0 crore at March 2026.
- Creative Graphics' H1 FY27 revenue rose 32.6% to Rs 233.3 crore, while profit after tax declined 40.4% to Rs 7.3 crore.
- Creative Graphics said all planned capex is complete and disclosed Rs 200 crore of working-capital limits.
powered by IRIS
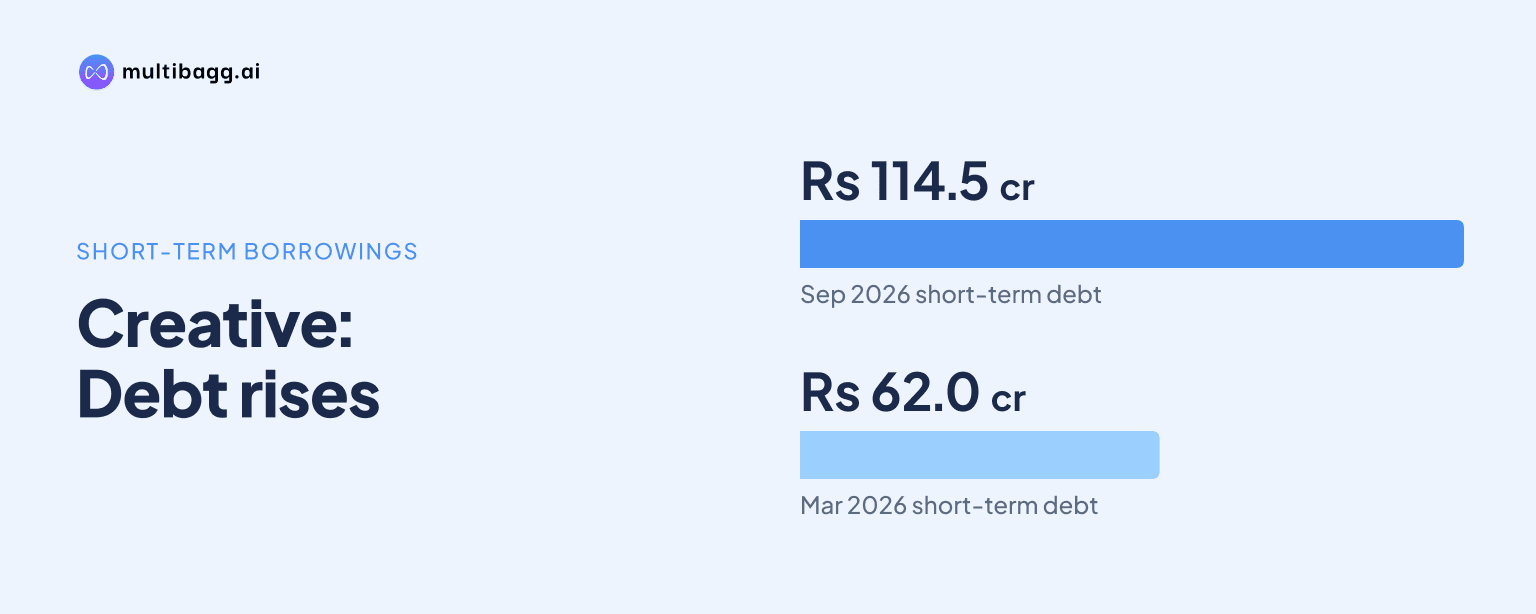
Creative Graphics Solutions India Limited added Rs 37.4 crore of net borrowings in H1 FY27, with the increase entirely short-term, as receivables rose Rs 59.2 crore and inventory Rs 17.8 crore alongside 32.6% year-on-year revenue growth to Rs 233.3 crore.
Know Creative Graphics Solutions India inside out
Results, valuation, peers and who's buying, in one view.
Why did Creative Graphics add Rs 37.4 crore of borrowings in H1 FY27?
Creative Graphics said the Rs 37.4 crore increase in borrowings during H1 FY27 funded higher receivables and inventory as revenue expanded by 33%. Trade receivables increased from Rs 114.2 crore at March 2026 to Rs 173.3 crore at September 2026, while inventories rose from Rs 55.7 crore to Rs 73.5 crore over the six-month period.
The company stated that receivables rose Rs 59.2 crore and inventories rose Rs 17.8 crore, a combined Rs 77.0 crore increase in working-capital items. Revenue from operations reached Rs 233.3 crore in H1 FY27, compared with Rs 175.9 crore in H1 FY26 and Rs 170.1 crore in H2 FY26, linking the balance-sheet expansion with higher activity in both comparisons.
Trade payables increased Rs 29.6 crore to Rs 75.7 crore at September 2026, while cash and equivalents moved from Rs 9.2 crore to Rs 9.6 crore. Total assets rose Rs 100.1 crore, from Rs 279.7 crore at March 2026 to Rs 379.8 crore at September 2026.
How did Creative Graphics' debt mix change by September 2026?
Creative Graphics shifted further towards short-term borrowings by September 2026, as that balance increased Rs 52.5 crore to Rs 114.5 crore while long-term borrowings declined Rs 15.2 crore to Rs 14.7 crore. The presentation describes the net Rs 37.4 crore rise in borrowings as entirely short-term funding for receivables and inventory.
The difference between the short-term borrowing increase and the total borrowing increase reflects the reduction in long-term borrowings during H1 FY27. Creative Graphics also notes that short-term borrowings include current maturities of long-term debt, which are long-term obligations due within the current period.
Creative Graphics reported working-capital limits of Rs 200 crore, including Rs 60 crore from Citibank. CARE Ratings assigned the company a CARE BBB; Stable issuer rating on 12 October 2026, while finance costs rose to Rs 5.3 crore in H1 FY27 from Rs 3.0 crore in H1 FY26 and Rs 3.7 crore in H2 FY26.
What does completed capex mean for Creative Graphics' balance sheet?
Creative Graphics said all planned capital expenditure was complete, so it did not present the H1 FY27 borrowing increase as funding further planned capex. Property, plant and equipment including capital work in progress declined from Rs 72.5 crore at March 2026 to Rs 68.0 crore at September 2026.
The completed flexography projects include the Bengaluru plant, which opened in August 2025 and recorded its first full half-year in H1 FY27. The Oman plant was installed but had not started commercial operations because of war-related supply-chain and manpower challenges; Creative Graphics said no further spending was planned for either plant.
Creative Graphics also disclosed pharmaceutical-packaging capacity of 44,000 metric tonnes per annum across Alu Alu, coating, tandem extrusion and new Alu Alu lines. The coating line began commercial production in H2 FY26, the tandem extrusion line started in April 2026, and the Boht EXPERTCOAT 1000 Alu foil line began production in October 2026.
New leases separately increased right-of-use assets by Rs 11.0 crore, from Rs 3.2 crore to Rs 14.3 crore, and lease liabilities by Rs 18.7 crore, from Rs 2.7 crore to Rs 21.4 crore. Those lease movements are reported separately from borrowings in the September 2026 balance sheet.
Got a follow-up? Ask IRIS
How did working-capital growth coincide with Creative Graphics' profit performance?
Creative Graphics reported H1 FY27 revenue of Rs 233.3 crore but earnings before interest, tax, depreciation and amortisation of Rs 19.5 crore, down from Rs 21.0 crore in H1 FY26. The earnings before interest, tax, depreciation and amortisation margin fell to 8.3% from 11.9%, while gross margin decreased by 214 basis points to 24.9%.
Costs increased faster than revenue in several categories during H1 FY27. Materials consumed rose 36.5% to Rs 175.1 crore, employee-benefit expense increased 41.7% to Rs 18.1 crore, and other expenses increased 48.5% to Rs 20.6 crore.
Profit after tax was Rs 7.3 crore in H1 FY27, down 40.4% from Rs 12.2 crore in H1 FY26, while net worth rose from Rs 125.5 crore at March 2026 to Rs 132.8 crore at September 2026. Creative Graphics said its Rs 26.1 crore net-worth increase since March 2025 came entirely from retained profit, with no new equity issued.
The H1 FY27 result was higher than H2 FY26 on revenue, earnings before interest, tax, depreciation and amortisation, and profit after tax. Revenue was Rs 63.2 crore above H2 FY26 revenue of Rs 170.1 crore, earnings before interest, tax, depreciation and amortisation were Rs 7.1 crore above Rs 12.4 crore, and profit after tax was Rs 0.7 crore above Rs 6.6 crore; however, the profit-after-tax margin of 3.1% remained below H2 FY26's 3.9%.
Conclusion
Creative Graphics' September 2026 balance sheet shows that the rise in receivables and inventory exceeded the increase in net borrowings, with trade payables and lease-related liabilities also higher. Revenue growth lifted H1 FY27 sales to Rs 233.3 crore, but higher material, employee and other costs coincided with lower earnings before interest, tax, depreciation and amortisation and lower profit after tax than in H1 FY26.
The next disclosed operating developments are the ramp-up of installed capacity rather than additional planned capex. Creative Graphics has said the Oman plant remains awaiting commercial start, while the new Alu foil line began production in October 2026; its management of receivables, inventory, short-term borrowings and the Rs 200 crore working-capital limits remains the balance-sheet item to watch.