










Creative Graphics revenue rises 33% as half-year profit falls 40%
Key highlights
- Creative Graphics reported Rs 233.27 crore of revenue from operations for the half year ended September 30, 2026, up 33% year on year.
- Creative Graphics’ consolidated profit after tax fell 40% to Rs 7.28 crore from Rs 12.21 crore.
- Total expenses increased 39% to Rs 223.24 crore, compared with Rs 160.48 crore a year earlier.
- Trade receivables rose to Rs 173.33 crore at September 30, 2026 from Rs 114.16 crore at March 31, 2026.
powered by IRIS
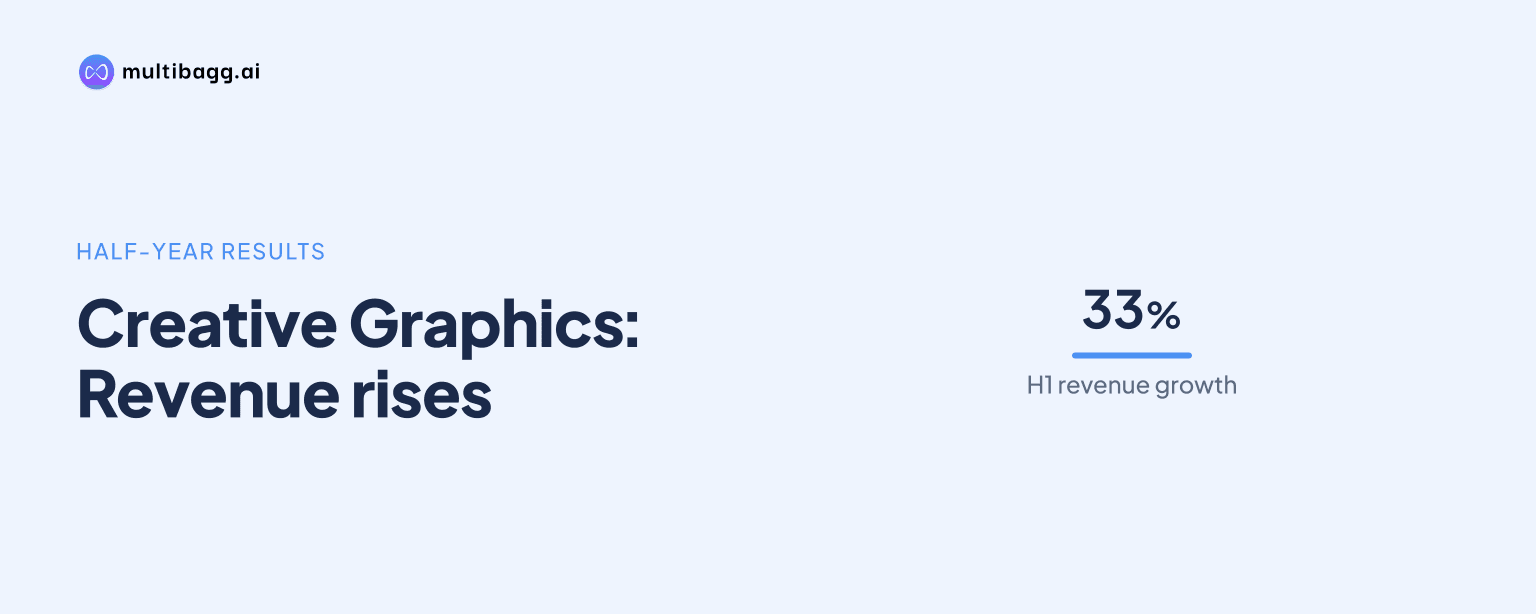
Creative Graphics Solutions India Limited reported consolidated profit after tax of Rs 7.28 crore for the half year ended September 30, 2026, down 40% from Rs 12.21 crore a year earlier, despite revenue from operations rising 33% to Rs 233.27 crore. Total expenses increased 39% to Rs 223.24 crore, exceeding revenue growth.
Know Creative Graphics Solutions India inside out
Results, valuation, peers and who's buying, in one view.
Why did Creative Graphics’ profit fall despite higher revenue?
Creative Graphics’ profit fell because total expenses rose 39% year on year to Rs 223.24 crore in the half year ended September 30, 2026, compared with a 33% increase in revenue from operations to Rs 233.27 crore. Profit before tax declined 39% to Rs 10.09 crore from Rs 16.41 crore, while total tax expense fell to Rs 2.54 crore from Rs 4.15 crore.
Cost of materials consumed, the largest expense, rose to Rs 175.11 crore from Rs 128.28 crore in the half year ended September 30, 2025. Employee-benefit expense increased to Rs 18.09 crore from Rs 12.77 crore, finance costs rose to Rs 5.31 crore from Rs 2.99 crore, depreciation and amortisation increased to Rs 4.12 crore from Rs 2.56 crore, and other expenses rose to Rs 20.61 crore from Rs 13.68 crore.
The reported figures show profit before tax equivalent to 4.32% of revenue in the latest half year, compared with 9.33% a year earlier. Profit after tax was equivalent to 3.12% of revenue, compared with 6.94% in the corresponding 2025 period; these are calculations based on the disclosed revenue and profit figures.
How did Creative Graphics perform against the preceding half year?
Creative Graphics’ profit after tax increased from Rs 6.56 crore in the half year ended March 31, 2026 to Rs 7.28 crore in the September 2026 half year. Revenue from operations increased to Rs 233.27 crore from Rs 170.09 crore, while profit before tax rose to Rs 10.09 crore from Rs 7.75 crore over the consecutive half-year periods.
The sequential comparison also records higher costs. Total expenses increased to Rs 223.24 crore from Rs 164.30 crore, with material costs rising from Rs 130.10 crore to Rs 175.11 crore and finance costs increasing from Rs 3.70 crore to Rs 5.31 crore. Other income declined to Rs 0.05 crore in the September 2026 half year from Rs 1.96 crore in the preceding half year.
Earnings per share, or EPS, were Rs 3.00 for both basic and diluted continuing operations in the half year ended September 30, 2026. This was above Rs 2.70 in the half year ended March 31, 2026 but below Rs 5.03 in the half year ended September 30, 2025; paid-up equity capital was Rs 24.29 crore in each reported period.
What changed in Creative Graphics’ balance sheet and cash flow?
Creative Graphics’ total assets rose to Rs 379.77 crore at September 30, 2026 from Rs 279.66 crore at March 31, 2026. Current assets increased to Rs 292.19 crore from Rs 201.38 crore, including trade receivables of Rs 173.33 crore, inventories of Rs 73.54 crore and other assets of Rs 35.75 crore.
Trade receivables increased by Rs 59.17 crore from Rs 114.16 crore at March 31, while inventories rose by Rs 17.81 crore from Rs 55.73 crore. Cash and cash equivalents were Rs 9.58 crore at September 30, compared with Rs 9.20 crore at the March 2026 year-end, according to the consolidated assets and liabilities statement.
Net cash used in operating activities was Rs 39.65 crore for the half year ended September 30, 2026, compared with Rs 5.17 crore used in the year ended March 31, 2026. The latest half-year outflow included Rs 59.02 crore absorbed by trade receivables, Rs 17.80 crore by inventories and Rs 15.33 crore by other assets, partly offset by a Rs 29.63 crore increase in trade payables.
Current borrowings rose to Rs 114.54 crore at September 30 from Rs 62.00 crore at March 31, while non-current borrowings declined to Rs 14.71 crore from Rs 29.90 crore. Net cash from financing activities was Rs 39.76 crore in the latest half year, including Rs 37.35 crore of net borrowings, and total equity increased to Rs 132.77 crore from Rs 125.50 crore.
Got a follow-up? Ask IRIS
What did the auditors flag in Creative Graphics’ results?
Creative Graphics’ independent auditors issued a limited-review conclusion on the unaudited consolidated results and said the company and its two subsidiaries had not identified creditors registered under the Micro, Small and Medium Enterprises Development Act, 2006. As a result, they had not determined or provided for interest potentially payable for delayed payments, and the auditors said the financial impact at September 30, 2026 was not ascertainable.
The auditors also said Creative Graphics and its two subsidiaries had not recognised provisions for gratuity and leave-encashment liabilities as required by Indian Accounting Standard 19, or Ind AS 19, Employee Benefits. They said employee-benefit expenses and related liabilities were understated to that extent, and the effect on consolidated results had not been determined.
The review report identifies Wahren India Private Limited and Creative Graphics Premedia Private Limited as the two subsidiaries. Their interim results, reviewed by other auditors, showed combined revenue of Rs 172.0192 crore, net profit after tax of Rs 1.7451 crore and net assets of Rs 15.7433 crore at September 30, 2026; the auditor’s conclusion was not modified in respect of the stated matters.
Does Creative Graphics report more than one business segment?
Creative Graphics stated that segment reporting was not applicable because its business activity falls within a single segment. The results therefore do not provide revenue, profit or asset information by product category, geography or operating division for the Rs 233.27 crore of revenue reported in the half year ended September 30, 2026.
Creative Graphics disclosed branches in Baddi, Bangalore, Noida, Mumbai, Chennai, Hyderabad, Ahmedabad, Pune and Oman. It did not disclose financial performance for those locations, while the limited-review report separately cited the two subsidiaries’ combined Rs 172.0192 crore of half-year revenue.
Conclusion
Creative Graphics delivered higher consolidated revenue in the half year ended September 30, 2026, but the 33% sales increase coincided with a 39% rise in total expenses. That difference reduced profit after tax by 40% to Rs 7.28 crore, while increases in receivables and inventories contributed to an operating cash outflow of Rs 39.65 crore.
The disclosed matters to watch are the unresolved amount of potential delayed-payment interest under the MSMED Act and the unrecognised gratuity and leave-encashment provisions under Ind AS 19. The auditors stated that the consolidated impact of both matters had not been determined as of September 30, 2026.