










DEE Q2 operating EBITDA margin reaches 20.1% as profit rises
Key highlights
- DEE reported a Q2 FY27 operating EBITDA margin of 20.1%, up 321 basis points from Q1 FY27.
- Q2 FY27 PAT rose 45.8% sequentially to Rs 23.5 crore while revenue declined 0.5% to Rs 293.0 crore.
- H1 FY27 operating EBITDA increased 35.9% year on year to Rs 108.6 crore and margin reached 18.5%.
- DEE’s H1 FY27 debt-to-equity ratio was 0.56 times, compared with 0.77 times at FY26.
powered by IRIS
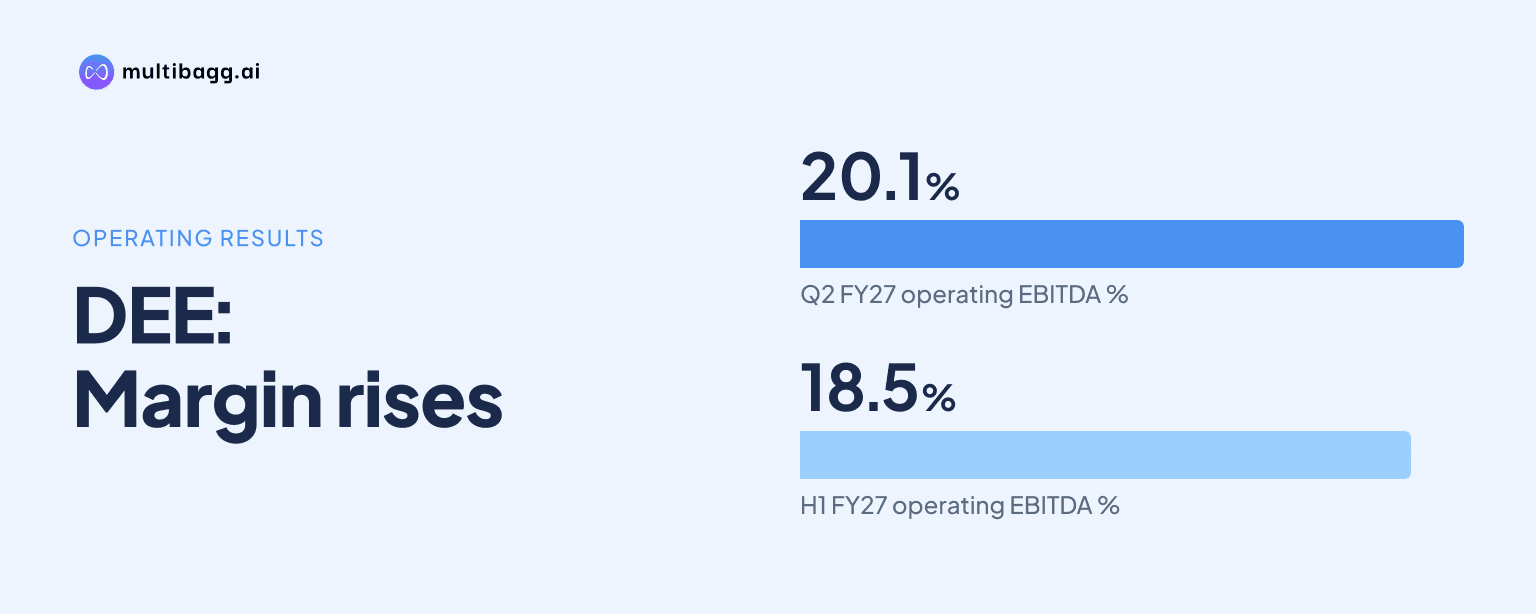
DEE Development Engineers reported a 20.1% operating EBITDA margin in Q2 FY27, up 321 basis points from Q1 FY27, while profit after tax rose 45.8% to Rs 23.5 crore despite a 0.5% sequential decline in revenue to Rs 293.0 crore. Operating EBITDA increased 18.4% to Rs 58.9 crore.
Know DEE Development Engineers inside out
Results, valuation, peers and who's buying, in one view.
How did DEE perform in Q2 FY27?
DEE reported consolidated revenue from operations of Rs 293.0 crore in Q2 FY27, compared with Rs 294.5 crore in Q1 FY27 and Rs 270.0 crore in Q2 FY26. Revenue was therefore lower by Rs 1.5 crore sequentially but higher by Rs 23.0 crore, or 8.5%, year on year.
Operating EBITDA, or earnings before interest, tax, depreciation and amortisation, rose to Rs 58.9 crore from Rs 49.7 crore in Q1 FY27 and Rs 44.1 crore in Q2 FY26. The 18.4% sequential increase in operating EBITDA contrasted with the 0.5% decline in revenue, lifting the margin to 20.1% from 16.9% in Q1 FY27 and 16.3% a year earlier.
DEE’s Q2 FY27 operating EBITDA was 33.7% above Q2 FY26, exceeding the 8.5% increase in revenue over that period. The margin increased by 379 basis points year on year; 100 basis points equal one percentage point.
Why did DEE’s Q2 FY27 profit grow faster than revenue?
DEE’s profit after tax, or PAT, rose faster than revenue because operating EBITDA increased by Rs 9.2 crore sequentially while interest expense fell by Rs 1.9 crore. PAT reached Rs 23.5 crore in Q2 FY27, compared with Rs 16.1 crore in Q1 FY27 and Rs 17.8 crore in Q2 FY26.
Profit before tax increased to Rs 29.9 crore from Rs 20.1 crore sequentially and Rs 22.3 crore year on year. Interest expense declined 10.8% from Rs 17.2 crore in Q1 FY27 to Rs 15.3 crore, while other income fell from Rs 2.5 crore to Rs 2.1 crore and depreciation and amortisation increased from Rs 15.0 crore to Rs 15.8 crore.
PAT margin increased to 8.0% in Q2 FY27 from 5.5% in Q1 FY27 and 6.6% in Q2 FY26. Taxes rose to Rs 6.4 crore from Rs 4.0 crore sequentially, while diluted earnings per share rose to Rs 3.14 from Rs 2.32 and Rs 2.56 in the respective comparison quarters. The presentation does not identify a specific operational cause for the quarterly margin expansion.
What did DEE report for H1 FY27?
DEE reported H1 FY27 revenue from operations of Rs 587.4 crore, up 19.0% from Rs 493.8 crore in H1 FY26. Operating EBITDA grew 35.9% to Rs 108.6 crore from Rs 79.9 crore, taking the half-year operating EBITDA margin to 18.5% from 16.2%.
H1 FY27 PAT increased 27.8% to Rs 39.5 crore from Rs 30.9 crore, and PAT margin rose to 6.7% from 6.3%. Profit before tax increased 30.9% to Rs 49.9 crore, while interest expense rose 28.9% to Rs 32.5 crore and depreciation and amortisation increased 19.2% to Rs 30.9 crore.
The half-year comparison shows revenue growth of 19.0%, whereas Q2 FY27 revenue was 0.5% below Q1 FY27. In both comparisons, operating EBITDA grew faster than revenue: by 35.9% in H1 FY27 and by 18.4% in Q2 FY27. Diluted earnings per share for H1 FY27 were Rs 5.49, up 23.1% from Rs 4.46 in H1 FY26.
Got a follow-up? Ask IRIS
How did DEE’s leverage and return ratios change?
DEE’s debt-to-equity ratio declined to 0.56 times in H1 FY27 from 0.77 times at FY26, while net debt to EBITDA including other income declined to 3.02 times from 3.43 times. The company states that the H1 FY27 debt-to-equity ratio reflects a fresh equity infusion through a preferential issue.
Debt to equity had been 0.58 times in FY25 and 0.95 times in FY24, while net debt to EBITDA was 3.21 times in FY25 and 3.55 times in FY24. The presentation does not provide absolute debt, cash or equity figures alongside the H1 FY27 ratios.
Return on capital employed was 9.1% in H1 FY27, compared with 10.1% in FY26, and return on equity was 7.5%, compared with 9.1%. DEE notes that the H1 FY27 return on capital employed and return on equity figures also reflect the preferential equity issue, and H1 FY27 is a partial-year period rather than a full-year comparison.
What is DEE’s financial roadmap through FY30?
DEE management’s Vision 2030 roadmap targets FY30 revenue of Rs 2,500 crore and an operating EBITDA margin of 19% to 20%. The plan starts with FY26 revenue of Rs 1,142 crore and presents estimated revenue of Rs 1,500 crore for FY27 and Rs 1,800 crore for FY28, implying about 22% compound annual growth from FY26 to FY30.
Management also cites an executable order book of Rs 2,586 crore, FY27 order visibility of Rs 2,000 crore and a 40% bid success rate. It identifies power-sector mix, operating leverage, backward integration through a pipe mill, automation, plant proximity to ports and biomass pellets as margin-expansion levers.
The roadmap targets PAT of 9% to 10% of revenue in FY30, operating EBITDA compound annual growth of about 26% from FY26 to FY30, and asset turns of about 3.5 times from below 2 times. Management indicates planned maintenance capital expenditure of Rs 20 crore to Rs 30 crore, while cautioning that forward-looking statements depend on assumptions and may differ materially from actual outcomes.
Conclusion
DEE’s Q2 FY27 result combined sequentially flat revenue of Rs 293.0 crore with an 18.4% increase in operating EBITDA and a 45.8% increase in PAT. The resulting 20.1% operating EBITDA margin and 8.0% PAT margin exceeded both Q1 FY27 and Q2 FY26 levels, while H1 FY27 operating EBITDA growth of 35.9% outpaced 19.0% revenue growth.
The next measures to watch are progress towards management’s FY30 revenue target of Rs 2,500 crore and its 19% to 20% operating EBITDA margin range. Conversion of the Rs 2,586 crore executable order book, delivery against Rs 2,000 crore of FY27 order visibility, and future leverage and return ratios following the preferential equity issue are also disclosed points for tracking.