










Dixon operating cash flow turns negative on working capital
Key highlights
- Dixon reported Rs 280 crore of negative operating cash flow at 30 September 2026, despite profit before tax of Rs 1,390 crore.
- A Rs 1,272 crore working-capital outflow included trade receivables rising by Rs 5,871 crore and inventories increasing by Rs 3,227 crore.
- Negative operating cash flow and Rs 700 crore of capital expenditure resulted in Rs 980 crore of negative free cash flow.
- Dixon’s total debt increased to Rs 669 crore from Rs 468 crore, while closing cash and cash equivalents fell to Rs 389 crore from Rs 767 crore.
powered by IRIS
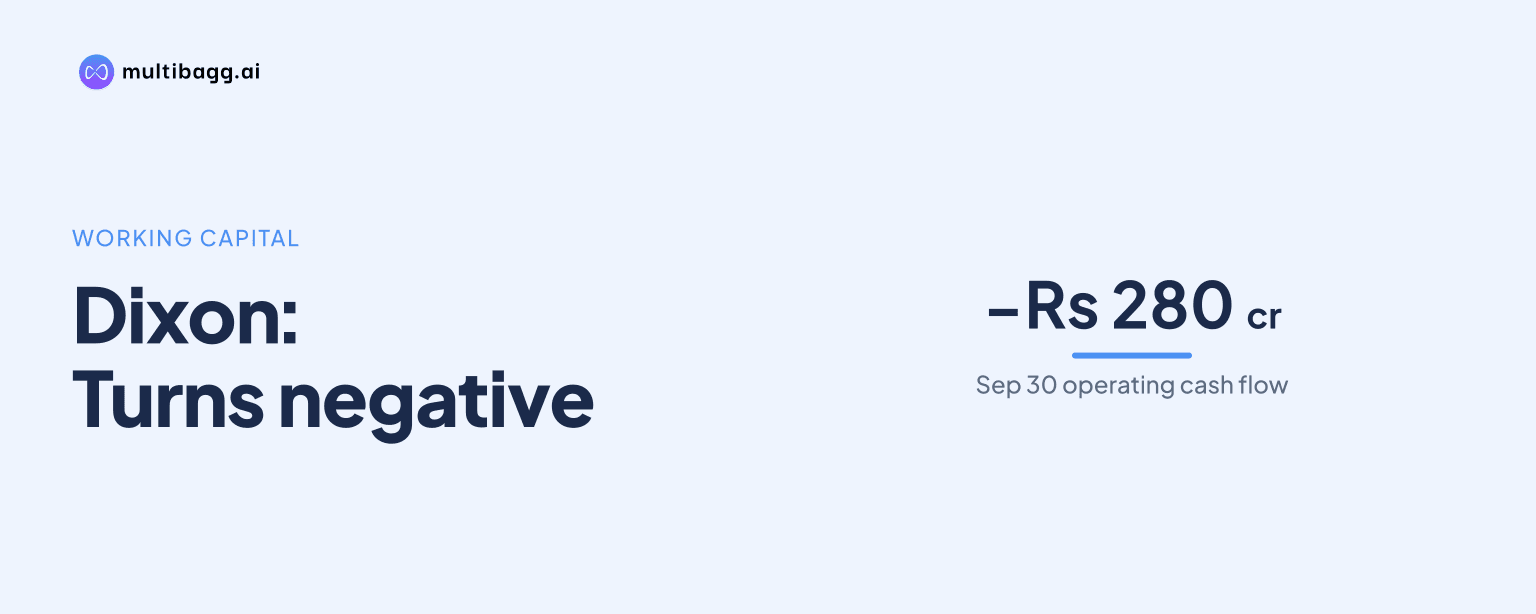
Dixon reported Rs 280 crore of negative cash flow from operating activities at 30 September 2026 despite profit before tax of Rs 1,390 crore. A Rs 1,272 crore working-capital outflow and Rs 700 crore of capital expenditure resulted in Rs 980 crore of negative free cash flow, versus Rs 724 crore at 31 March 2026.
Know Dixon Technologies (India) inside out
Results, valuation, peers and who's buying, in one view.
Why did Dixon report negative operating cash flow?
Dixon reported negative operating cash flow because a Rs 1,272 crore working-capital change outweighed profit before tax and the cash-flow adjustments in its 30 September 2026 presentation. Profit before tax was Rs 1,390 crore, while depreciation and amortisation added Rs 217 crore and other items, including net interest expenses and employee stock option plan expenses, added Rs 53 crore. These were partly offset by a Rs 576 crore notional fair-value gain and Rs 92 crore of taxes paid.
Cash flow from operating activities was negative Rs 280 crore at 30 September 2026, compared with positive Rs 1,782 crore in the 31 March 2026 column. The working-capital line moved from a positive Rs 224 crore contribution at 31 March to a Rs 1,272 crore outflow at 30 September, a Rs 1,496 crore deterioration in the reported figures.
The filing identifies the Rs 576 crore fair-value gain at 30 September 2026 as relating to Dixon’s stake in Aditya Infotech Ltd. The corresponding gain was Rs 671 crore at 31 March 2026, while that column also included a Rs 22 crore gain on the transfer of the lighting business undertaking. The 30 September column did not report that transfer gain.
How much did Dixon’s receivables and inventories increase?
Dixon’s trade receivables increased by Rs 5,871 crore and inventories increased by Rs 3,227 crore between 31 March and 30 September 2026. Trade receivables rose to Rs 12,401 crore from Rs 6,530 crore, while inventories reached Rs 7,064 crore from Rs 3,837 crore. Together, those balances increased by Rs 9,098 crore over the balance-sheet comparison.
Dixon’s current liabilities and provisions also rose, increasing by Rs 8,389 crore to Rs 20,979 crore at 30 September 2026. That increase offset most of the Rs 8,945 crore rise in total current assets, leaving net current assets Rs 556 crore higher at Rs 1,482 crore. The cash-flow statement reports working capital as one Rs 1,272 crore aggregate and does not allocate that movement among receivables, inventories, payables and other balances.
What happened to Dixon’s free cash flow and capital expenditure?
Dixon reported Rs 980 crore of negative free cash flow at 30 September 2026 because Rs 280 crore of negative operating cash flow was followed by Rs 700 crore of capital expenditure. Dixon defines free cash flow as cash flow from operating activities less capital expenditure. In the 31 March 2026 column, Rs 1,782 crore of operating cash flow less Rs 1,058 crore of capital expenditure produced Rs 724 crore of free cash flow.
Capital expenditure was Rs 358 crore lower in the 30 September column than in the 31 March column, but that reduction did not offset the Rs 2,062 crore change in operating cash flow. Investing activities included Rs 283 crore under sales or purchases of investments and other bank balances, resulting in negative Rs 417 crore of investing cash flow. This was less negative than the Rs 1,251 crore reported in the 31 March column.
Got a follow-up? Ask IRIS
How did the cash outflow affect Dixon’s cash and debt?
Dixon’s closing cash and cash equivalents declined by Rs 378 crore to Rs 389 crore at 30 September 2026 from Rs 767 crore at 31 March 2026. The reported net change in cash and cash equivalents was also negative Rs 378 crore. Separately, cash, bank balances and short-term investments on the balance sheet fell by Rs 645 crore to Rs 596 crore from Rs 1,241 crore.
Financing activities supplied Rs 319 crore at 30 September 2026, compared with a Rs 108 crore outflow in the 31 March column. The 30 September figure included Rs 237 crore of proceeds from share issuance and Rs 196 crore of current borrowings. It was partly offset by Rs 28 crore of interest paid, Rs 40 crore of lease-liability repayments and Rs 46 crore of dividends paid.
Total debt increased to Rs 669 crore at 30 September 2026 from Rs 468 crore at 31 March 2026. Short-term borrowings rose to Rs 304 crore from Rs 108 crore, while long-term borrowings were Rs 365 crore, compared with Rs 360 crore. Dixon reported gross debt-to-equity unchanged at 0.1 times, while net debt-to-equity was 0.01 times versus negative 0.17 times.
What do Dixon’s operating-cost ratios show?
Dixon’s material cost consumed increased as a share of operating revenue while operating cash flow was negative at 30 September 2026. For H1 FY27, material costs represented 94.6% of operating revenue, compared with 92.7% in H1 FY26, an increase of 1.9 percentage points. This was the largest movement among the listed expenditure categories for the half-year comparison.
Other expenditure categories were lower as proportions of operating revenue in H1 FY27. Employee benefit expense declined to 1.1% from 1.3%, finance cost fell to 0.1% from 0.3%, depreciation and amortisation expense declined to 0.6% from 0.7%, and other expenses fell to 1.5% from 2.2%. These ratios describe expense composition, whereas the Rs 1,272 crore working-capital change records cash tied up in operating balances.
The quarterly figures showed a similar pattern in Q2 FY27, when material cost consumed was 94.9% of operating revenue against 92.9% in Q2 FY26. Other expenses fell to 1.3% from 2.0%, while finance cost was 0.1% versus 0.3%. The filing does not provide an explanation linking these expense ratios to the Rs 12,401 crore receivables or Rs 7,064 crore inventories at 30 September 2026.
Conclusion
Dixon’s 30 September 2026 cash-flow presentation shows that Rs 1,390 crore of profit before tax did not translate into operating cash during the reported period. The Rs 1,272 crore working-capital outflow coincided with a Rs 5,871 crore increase in receivables and a Rs 3,227 crore increase in inventories, taking operating cash flow to negative Rs 280 crore and free cash flow to negative Rs 980 crore.
The item to watch in later disclosures is the composition and movement of the Rs 1,272 crore working-capital outflow. Dixon reports the changes in receivables, inventories and current liabilities, but its cash-flow statement does not allocate the aggregate working-capital amount among those balances or disclose a collection, inventory-reduction or working-capital target.