










EAAA India Alternatives expects VAR income up to 30% of profit
Key highlights
- EAAA expects VAR to account for 25% to 30% of PAT across seven funds and five strategies.
- EAAA reported H1 FY27 PAT of Rs 169 crore, up 35% from Rs 125 crore in H1 FY26.
- Fee-paying assets under management reached Rs 49,164 crore at 30 September 2026, up 28% year on year.
- EAAA estimated dry powder of about Rs 20,000 crore to Rs 25,000 crore within Rs 95,000 crore of total assets under management.
powered by IRIS
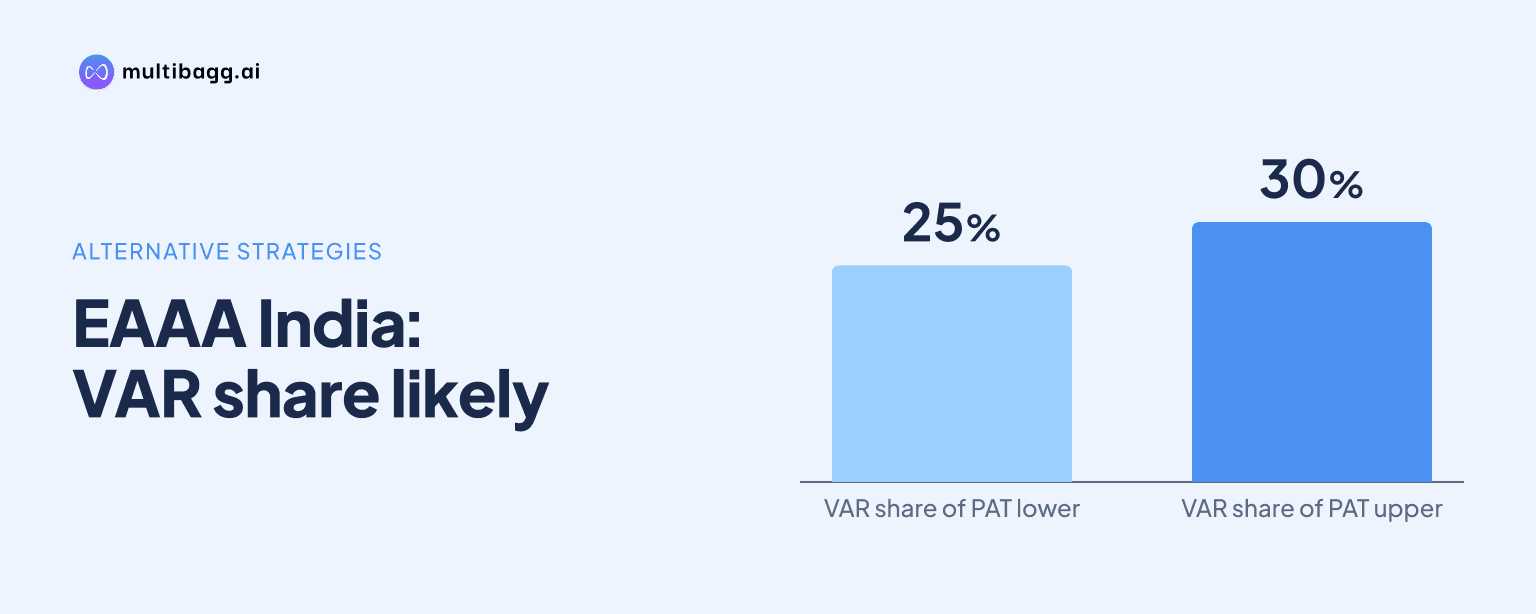
EAAA India Alternatives expects variable additional return, or VAR, to account for 25% to 30% of profit after performance-linked earnings expanded across seven funds and five strategies. Management said annual cash distributions in income and yield funds and contracted revenue from completed operating assets make VAR more regular.
Know EAAA India Alternatives inside out
Results, valuation, peers and who's buying, in one view.
Why does EAAA expect VAR income to become more recurring?
EAAA expects VAR to form 25% to 30% of overall profit because it is now generated across seven funds and five strategies, rather than being tied to an isolated exit. Management described VAR, its term for performance-linked additional return, as recurring and regular after building the platform over 17 years.
The mechanism is based on closed-end funds that generally run for six to eight years. Management said income and yield strategies make significant annual cash distributions, allowing client hurdle returns to be paid through the fund life rather than accumulating until a final exit. VAR is paid after clients receive their hurdle returns, and management said this structure gives its strategies greater visibility than return models dependent on equity-sale events.
EAAA also said its credit and real-asset strategies have sources of cash flow that are not equity-correlated. Credit investments generate interest income and principal repayments, while its operating assets generate office rentals, road tolls and annuity revenue. Management said completed assets can have contracted revenue visibility of up to 20 years, although it did not provide a quarterly VAR target or a fund-by-fund VAR forecast.
How large is EAAA's fee-paying asset base?
EAAA reported fee-paying assets under management, or FPAUM, of Rs 49,164 crore at 30 September 2026, compared with about Rs 38,500 crore a year earlier and about Rs 26,000 crore in September 2024. Management said the year-on-year increase was 28%, while its preferred three-year rolling compound annual growth rate was 23%.
The FPAUM base generates management and advisory fees, while VAR is an additional earnings stream. In H1 FY27, total income rose 35% year on year to Rs 616 crore, and management and advisory fees increased 24% to Rs 333 crore. Management said fee income is calculated based on the actual number of days that assets are fee-paying, so recently raised capital takes time to make a full contribution.
EAAA's overall assets under management were Rs 95,000 crore, exceeding its Rs 49,164 crore of FPAUM. Management said the gap includes capital repaid by live funds, which can remain relevant to VAR calculations, and undeployed capital. It estimated dry powder at about Rs 20,000 crore to Rs 25,000 crore, which could enter FPAUM as investments are made.
What did EAAA report for H1 FY27 profit and returns?
EAAA reported profit after tax, or PAT, of Rs 169 crore in H1 FY27, up 35% from Rs 125 crore in H1 FY26. Quarterly PAT was Rs 88 crore, which management said was 28% higher year on year and 9% above the first quarter, alongside the increase in FPAUM.
PAT yield was about 0.72% of FPAUM for H1 FY27 and 0.71% for the quarter. Management's medium- to long-term objective is a PAT yield of 65 to 70 basis points, where 100 basis points equal one percentage point. The reported first-half and quarterly measures were within that management target range.
Return on equity improved to about 29.5% from about 25% a year earlier, while the cost-to-income ratio remained in a 64% to 65% range, according to management. EAAA declared a dividend of Rs 7 per share, equal to 140% of face value. Management said it aims to distribute about 40% to 50% of profit over the long term, having also referred to an aspiration of around 50% of annual earnings.
Got a follow-up? Ask IRIS
What cash flows support EAAA's income and yield strategies?
EAAA collected more than Rs 6,300 crore across its strategies in H1 FY27, with these realisations providing cash flows to fund investors. Over 17 years, its credit strategies invested nearly Rs 43,000 crore across more than 190 companies and realised more than Rs 46,000 crore in capital back, according to management.
At 30 September 2026, EAAA said it owned and operated about 5.6 million square feet of completed office space, nearly 7,700 kilometres of roads, 1.73 gigawatts of solar capacity and nearly 1,800 circuit kilometres of transmission lines. These assets produce rents, tolls, annuities or contracted payments, which management cited as a source of cash-flow visibility for clients and for hurdle-return payments.
EAAA won the Toll-Operate-Transfer 19 road bundle at a bid value of Rs 2,259 crore, covering nearly 600 lane kilometres on the Madurai-Tuticorin-Thanjavur-Trichy stretch in Tamil Nadu. It also acquired a nearly 1 million-square-foot Grade A Pune office park that was 95% occupied. Separately, Infrastructure Fund 1 completed its lifecycle in H1 FY27 and delivered a gross internal rate of return of 19.3%, management said.
How will fundraising and distribution costs affect EAAA's fees?
EAAA raised close to Rs 20,000 crore in H1 FY27, including about Rs 8,250 crore across special situations, infrastructure and private-equity funds and nearly Rs 12,000 crore in listed infrastructure investment trust strategies. Management said new capital becomes fee-paying as it is deployed, which is why management-fee growth can lag the reported 28% rise in FPAUM.
Management also said the early full exit of Infrastructure Fund 1 brought forward distribution-cost amortisation into Q1 FY27 because the fund ended before its scheduled life. There was no VAR-sharing arrangement with distributors, management said. Distribution costs are amortised over six to seven years, while cash payouts are one-third upfront and two-thirds over the remaining fund tenure.
Institutional clients account for 49% of EAAA's assets under management and are approached directly, while high-net-worth, ultra-high-net-worth and family-office clients account for 51% and are generally served through distributors. Management said 77% of assets under management come from repeat clients. Average distribution cost is about 30 basis points, which management said translates to about 60 basis points in the profit and loss account given the approximately 50-50 distribution mix.
Conclusion
EAAA's expected 25% to 30% VAR share of PAT rests on a wider set of seven funds and five strategies, alongside annual client cash distributions and revenue from credit and operating assets. The H1 FY27 figures show the scale of the fee base and earnings: Rs 49,164 crore of FPAUM, Rs 333 crore of management and advisory fees, and Rs 169 crore of PAT.
The next measures to watch are deployment of the estimated Rs 20,000 crore to Rs 25,000 crore of dry powder and fundraising for the Special Situations Fund, Infrastructure Yield Fund and the second Commercial Real Estate Fund vintage. Management also said Private Equity Fund 2 could be nearly three times the size of its first private-equity fund, while its stated medium- to long-term aim is 20% to 30% growth in FPAUM and PAT.