










Energy Infrastructure Trust Returned More Than 99% Cashflows
Key highlights
- EIT reported returning more than 99% of net distributable cashflows over five years.
- EIT reported cumulative return of capital of Rs 56.02 per unit through Sept'26.
- EIT reported cumulative return on capital of Rs 64.03 per unit through Sept'26.
- EIT distributed Rs 1,012.6 crore in FY 25-26, equal to 98.9% of net distributable cashflows.
powered by IRIS
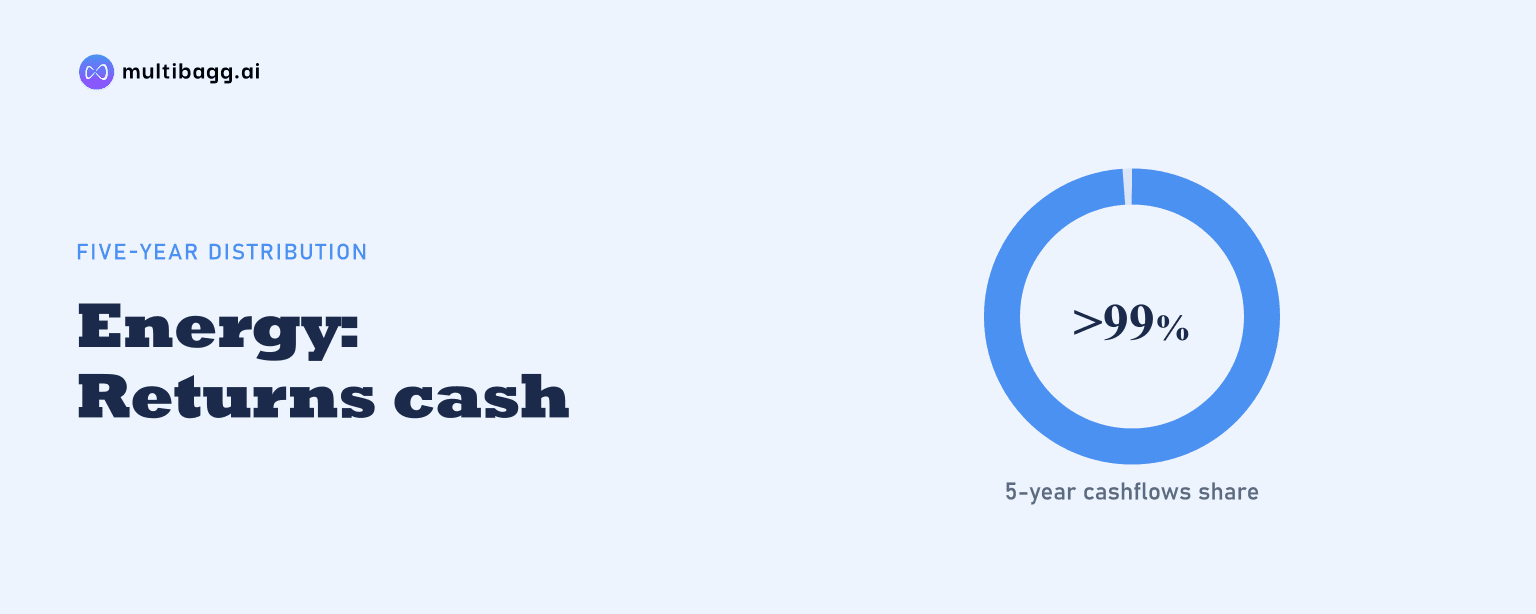
Energy Infrastructure Trust returned more than 99% of net distributable cashflows over five years, according to its presentation, while cumulative return of capital reached Rs 56.02 per unit and return on capital reached Rs 64.03 per unit from its 2019 acquisition through Sept'26. Its reported distribution percentage ranged from 91.5% to 99.9% across seven disclosed periods.
Know Energy Infrastructure Trust inside out
Results, valuation, peers and who's buying, in one view.
How much available cash has EIT distributed?
EIT reported that it returned more than 99% of net distributable cashflows over five years. The presentation describes the record as a distribution policy in place since the 2019 acquisition, with nearly all available cashflows returned to investors year after year.
The reported distribution percentage was 99.9% in FY 20-21, FY 21-22 and FY 22-23. It fell to 91.5% in FY 23-24, then rose to 99.8% in FY 24-25, 98.9% in FY 25-26 and 99.9% in H1 FY26-27. FY 23-24 was therefore the lowest of the seven disclosed periods, while the reported half year matched the 99.9% level recorded in three full financial years.
Cash distributed was highest at Rs 1,169.5 crore in FY 20-21 and next highest at Rs 1,140.6 crore in FY 24-25. FY 23-24 recorded both the lowest full-year cash distribution, at Rs 973.1 crore, and the lowest distribution percentage, at 91.5%; the presentation does not provide a year-specific explanation for that result.
What has EIT paid per unit since 2019?
EIT reported Rs 56.02 per unit of cumulative return of capital and Rs 64.03 per unit of cumulative return on capital from the 2019 acquisition through Sept'26. The presentation reports these as separate cumulative components and states an average annual distribution of Rs 15-Rs 16 per unit.
The historical total distribution exceeded that stated Rs 15-Rs 16 average range in FY 20-21, at Rs 17.6 per unit, and in FY 24-25, at Rs 17.2 per unit. It was below the range in FY 23-24, at Rs 14.7 per unit. H1 FY26-27 shows Rs 7.7 per unit, but that is a half-year period rather than a full financial year.
The composition changed in FY 25-26. Return on capital was higher than return of capital in each full year from FY 20-21 through FY 24-25, but return of capital reached Rs 8.1 per unit in FY 25-26 versus Rs 7.2 per unit for return on capital. In H1 FY26-27, the respective figures were Rs 4.2 and Rs 3.5 per unit.
Got a follow-up? Ask IRIS
How consistent has EIT's per-unit distribution been?
EIT's total distribution ranged from Rs 14.7 to Rs 17.6 per unit across the six full financial years from FY 20-21 to FY 25-26. The highest total was Rs 17.6 per unit in FY 20-21, followed by Rs 17.2 per unit in FY 24-25, while the low was Rs 14.7 per unit in FY 23-24.
Total distribution declined from Rs 17.6 per unit in FY 20-21 to Rs 15.9 in FY 21-22, then to Rs 15.8 in FY 22-23 and Rs 14.7 in FY 23-24. It increased by Rs 2.5 per unit to Rs 17.2 in FY 24-25 before declining by Rs 1.9 per unit to Rs 15.3 in FY 25-26.
The cash amounts and the payout percentages did not move together in absolute terms. EIT distributed Rs 1,140.6 crore at 99.8% in FY 24-25, compared with Rs 1,012.6 crore at 98.9% in FY 25-26. This reflects that the percentage is measured against net distributable cashflows, while the table separately presents the cash amount distributed.
Can EIT distribute more than net distributable cashflows?
EIT states that distributions exceeding net distributable cashflows can be made from opening surplus cash available. This is the mechanism disclosed in the note to the distribution table, although the presentation does not identify the periods in which surplus cash was used or quantify that opening surplus.
The distinction matters because the seven reported periods show cash distributions between Rs 515.1 crore in H1 FY26-27 and Rs 1,169.5 crore in FY 20-21, alongside payout percentages from 91.5% to 99.9%. The presentation does not provide the underlying net distributable cashflow amount for each individual period.
EIT does not state a future distribution target, a minimum payment per unit or a planned retained-cash level on the disclosed page. Its stated historical record is more than 99% of net distributable cashflows returned over five years, alongside the Rs 56.02 per unit return of capital and Rs 64.03 per unit return on capital reported through Sept'26.
Conclusion
EIT's reported record indicates that its distributions have closely tracked net distributable cashflows, with six of the seven disclosed periods showing a payout percentage of at least 98.9%. Total annual distributions ranged from Rs 14.7 to Rs 17.6 per unit in the six full financial years shown, while the split shifted toward return of capital in FY 25-26.
The next disclosure to watch is the full-year FY26-27 distribution outcome following the Rs 7.7 per unit paid in H1 FY26-27 at a 99.9% distribution percentage. The source leaves unresolved the underlying net distributable cashflow by period, the use of any opening surplus cash and the final full-year mix between return of capital and return on capital.