










PIL H1 gas throughput rises 9% to 37.48 mmscmd as RLNG demand increases
Key highlights
- PIL averaged 37.48 mmscmd in H1 FY27, up 9% from 34.49 mmscmd in H1 FY26.
- PIL reported RLNG throughput of 10.1 mmscmd in H1 FY26-27, compared with 5.3 mmscmd in FY25-26.
- CGD represented 34% of PIL's H1 FY27 volume and fertilisers represented 23%, for a combined 57% share.
- PIL reported 44% utilisation against stated pipeline capacity of 85 mmscmd in H1 FY27.
powered by IRIS
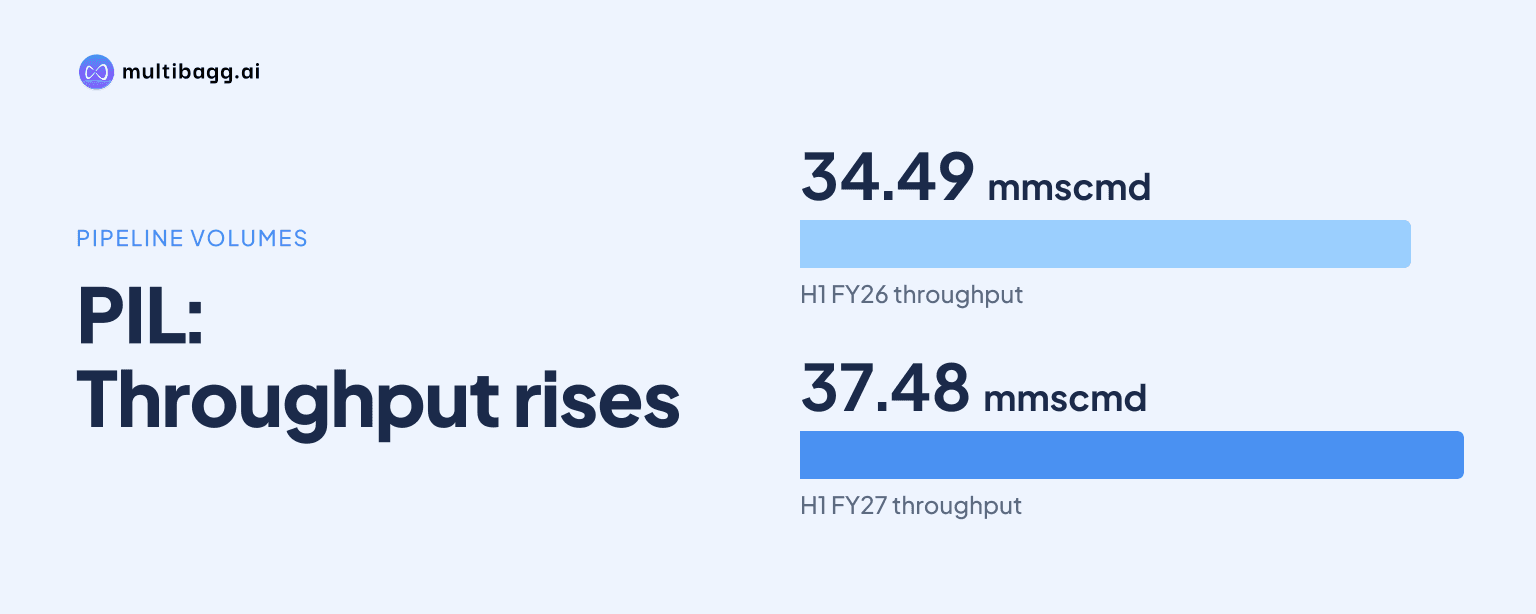
Pipeline Infrastructure Limited (PIL) averaged 37.48 million metric standard cubic metres per day (mmscmd) of gas throughput in H1 FY27, 9% above 34.49 mmscmd in H1 FY26. PIL attributed the increase to higher regasified liquefied natural gas (RLNG) demand from fertiliser and steel sectors, while city gas distribution (CGD) represented 34% of the mix.
Know Energy Infrastructure Trust inside out
Results, valuation, peers and who's buying, in one view.
What drove PIL's 9% H1 FY27 throughput increase?
PIL's H1 FY27 average throughput rose by 2.99 mmscmd from 34.49 mmscmd in H1 FY26 to 37.48 mmscmd. The H1 FY27 figure was also 3.07 mmscmd above the 34.41 mmscmd reported in H2 FY26. The presentation attributes the first-half increase to higher RLNG demand from fertiliser and steel sectors, with intermittent demand from power and refinery customers also contributing.
PIL recorded its highest single-day volume of 46.91 mmscmd in July 2026, which was 9.43 mmscmd above its H1 FY27 average. This peak occurred before volume shortfalls in August and September, when a key fertiliser customer shut down and an Oil and Natural Gas Corporation domestic gas field had a delayed ramp-up. The presentation says steel and fertiliser demand partly offset those disruptions.
How did PIL's customer demand mix change?
PIL's H1 FY27 mix shifted further toward CGD and fertiliser customers, according to the presentation's internal estimates. CGD accounted for 34% of throughput, up from 26% in FY25-26, while fertilisers accounted for 23%, up from 19%. Together, those two segments represented 57% of H1 FY27 volume, compared with 45% in FY25-26.
Refinery and petrochemical customers represented 21% of H1 FY27 throughput, down from 24% in FY25-26 and 64% in FY20-21. The others category fell to 22% from 31% in FY25-26. These changes show a different mix of transported gas, but the segment percentages do not establish the absolute H1 FY27 volume of each customer category.
How important was RLNG to PIL's H1 FY27 volumes?
PIL reported RLNG throughput of 10.1 mmscmd in the H1 FY26-27 column of its longer-term volume table, compared with 5.3 mmscmd in FY25-26. Reliance was still the largest identified source at 23.5 mmscmd in H1 FY26-27, while Oil and Natural Gas Corporation contributed 3.9 mmscmd. The reported components total 37.5 mmscmd after rounding, close to the 37.48 mmscmd H1 FY27 average on the volume-resilience page.
The comparison with FY25-26 indicates that the reported RLNG figure was higher while the reported Reliance figure was lower than 24.9 mmscmd in that full fiscal year. However, H1 FY26-27 covers a half-year and FY25-26 covers a full year, so the figures are not like-for-like period comparisons. PIL specifically identified RLNG demand from fertiliser and steel users as a key H1 FY27 driver.
Got a follow-up? Ask IRIS
How much pipeline capacity headroom does PIL retain?
PIL reported 44% pipeline utilisation in H1 FY27 against stated capacity of 85 mmscmd. Utilisation was 41% in FY25-26 and 42% in FY24-25, compared with 14% in FY20-21. The increase to 44% accompanied H1 FY27 average throughput of 37.48 mmscmd, while the presentation identifies remaining capacity headroom.
PIL's network comprises 1,483 kilometres of pipeline and 10 compressor stations, connecting the Krishna Godavari Basin through Kakinada and Hyderabad towards Mumbai and Bharuch. The presentation describes PIL as the only pipeline connecting east to west to evacuate Krishna Godavari Basin gas. PIL also reports more than 60 gas transportation agreement customers and 16 connected geographical areas across Andhra Pradesh, Telangana and Maharashtra.
What should readers watch after the H1 FY27 disruptions?
PIL's reported August and September shortfalls make the timing of the key fertiliser customer's return and the delayed Oil and Natural Gas Corporation field ramp-up relevant to subsequent volumes. The H1 FY27 average remained 9% ahead of H1 FY26 despite those events because steel and fertiliser demand partly offset their effect. The July 2026 daily high of 46.91 mmscmd also showed throughput above the first-half average on at least one day.
PIL also links revenue growth to gas volumes and tariff increases. Its realised tariff is estimated at Rs 84.6 per million British thermal units for calendar year 2026, compared with Rs 77.1 for July 2019 to December 2025. The approved levelised tariff from January 2026 is Rs 74.6 per million British thermal units, with zonal approved tariffs ranging from Rs 67.0 in Zone 1 to Rs 87.6 in Zone 5.
Conclusion
PIL's H1 FY27 result shows that average throughput reached 37.48 mmscmd even as the traffic mix moved toward CGD and fertilisers. RLNG demand from fertiliser and steel customers was the stated operating driver, while CGD and fertilisers together accounted for 57% of the reported H1 FY27 mix, compared with 45% in FY25-26.
The next disclosed matters to watch are the effects of the key fertiliser-customer shutdown and the delayed Oil and Natural Gas Corporation field ramp-up on volumes after H1 FY27. PIL also has stated capacity of 85 mmscmd against 44% utilisation and a calendar-year 2026 realised tariff estimate of Rs 84.6 per million British thermal units following the January 2026 tariff change.