










ESDS Software Solution Limited H1FY27 revenue rises, margin falls
Key highlights
- ESDS reported H1FY27 revenue from operations of Rs 271.99 crore, up 24.6% year on year.
- ESDS's H1FY27 EBITDA margin declined to 41.8% from 46.4%, a fall of 456 basis points.
- Other expenses increased 55.5% to Rs 103.28 crore in H1FY27.
- ESDS charged Rs 2.34 crore of IPO marketing and advertising expense in Q2FY27.
powered by IRIS
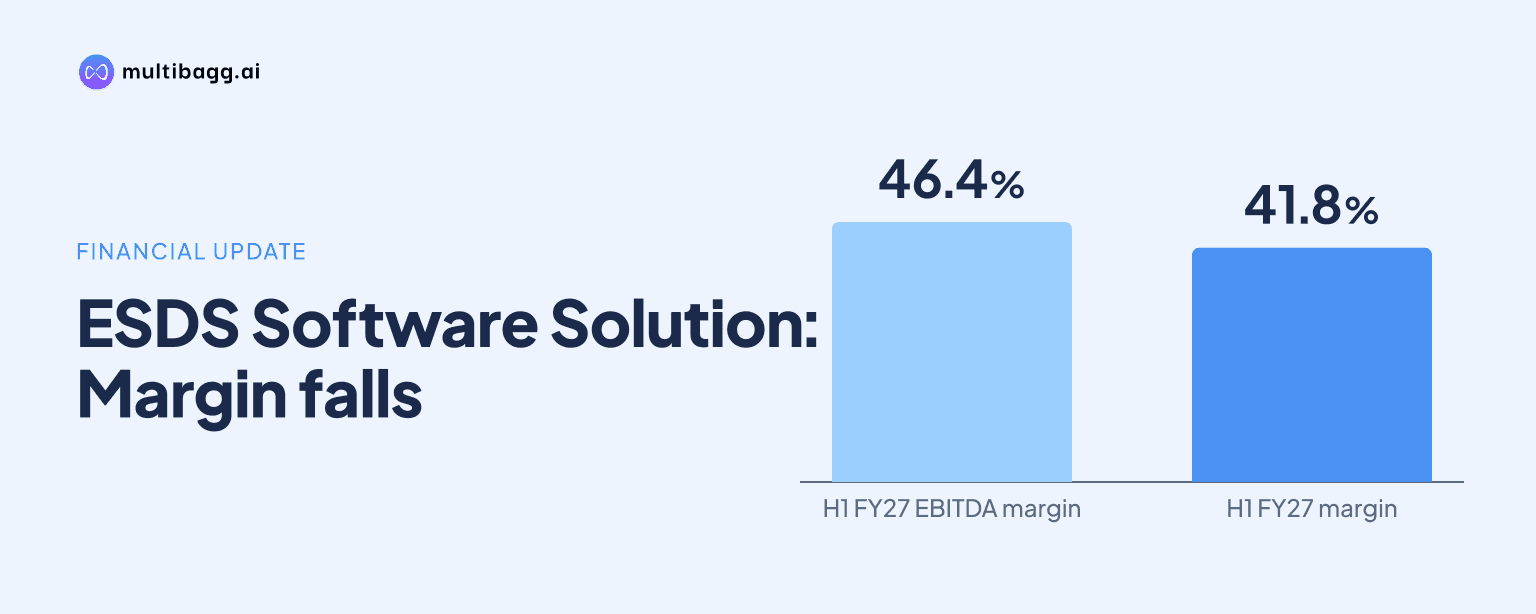
ESDS Software Solution Limited reported H1FY27 revenue from operations of Rs 271.99 crore, up 24.6% year on year, while EBITDA margin fell 456 basis points to 41.8% as total expenses increased 31.1% to Rs 202.23 crore. Profit after tax nevertheless rose 26.3% to Rs 60.37 crore.
Know ESDS Software Solution inside out
Results, valuation, peers and who's buying, in one view.
Why did ESDS's H1FY27 EBITDA margin decline?
ESDS's H1FY27 EBITDA margin declined because total expenses grew 31.1%, faster than the 24.6% increase in revenue from operations. Revenue rose to Rs 271.99 crore from Rs 218.37 crore in H1FY26, while total expenses increased to Rs 202.23 crore from Rs 154.27 crore. EBITDA increased 12.3% to Rs 113.75 crore, but this slower growth reduced the margin to 41.8% from 46.4%, a 456-basis-point decline.
Other expenses were the largest contributor to the cost increase, rising 55.5% to Rs 103.28 crore from Rs 66.42 crore. Depreciation and amortisation rose 23.7% to Rs 38.09 crore, while employee benefit expenses increased 8.4% to Rs 54.96 crore. Finance costs were the exception, declining 7.7% to Rs 5.90 crore from Rs 6.39 crore during the half year.
ESDS reported employee benefit expenses at 21.5% of revenue from operations in H1FY27, down from 26.8% in H1FY26. Other expenses, however, rose to 38.6% of revenue from operations from 36.6%. The movement shows that the increase in other costs outweighed the lower employee-cost ratio as revenue expanded by Rs 53.62 crore.
How did the IPO marketing charge affect ESDS's reported profit?
ESDS said Rs 2.34 crore of initial public offering marketing and advertising expense was charged to Q2FY27 expenses. Without this charge, H1FY27 profit before tax would have been Rs 78.94 crore rather than the reported Rs 76.60 crore, while H1FY27 EBITDA would have been Rs 116.10 crore instead of Rs 113.75 crore.
The expense was recorded in Q2FY27, when other expenses were Rs 50.78 crore, compared with Rs 17.99 crore in Q2FY26. ESDS said Q2FY27 profit before tax would have been Rs 42.47 crore without the marketing cost, against reported profit before tax of Rs 40.13 crore. The presentation does not provide an adjusted profit-after-tax figure.
On a reported basis, Q2FY27 revenue from operations rose 47.5% year on year to Rs 138.34 crore and 3.5% from Rs 133.66 crore in Q1FY27. Q2FY27 EBITDA increased 18.3% year on year to Rs 57.76 crore, but the EBITDA margin was 41.8%, down from 52.0% in Q2FY26 and nearly unchanged from 41.9% in Q1FY27.
Got a follow-up? Ask IRIS
How did ESDS's customer and revenue mix change in H1FY27?
ESDS's H1FY27 revenue mix shifted toward banking, financial services and insurance, or BFSI, and Infrastructure as a Service, or IaaS. BFSI accounted for 27.6% of revenue, up from 12.9% in H1FY26, while IaaS increased to 50.1% from 41.3%. Enterprise revenue declined to 46.4% from 58.4%, and government revenue declined to 26.0% from 28.7%.
Managed Services represented 31.0% of H1FY27 revenue, down from 43.4% a year earlier, while Software as a Service, or SaaS, rose to 18.2% from 15.4%. Total customer number increased to 2,545 from 1,850, but average revenue per customer declined to Rs 11 lakh from Rs 12 lakh.
Existing customers contributed 80.9% of H1FY27 revenue, up from 72.7% in H1FY26, while new customers contributed 19.1%, down from 27.3%. In Q2FY27, enterprise revenue represented 50.1% of revenue, compared with 41.0% in Q1FY27, whereas BFSI declined to 23.4% from 33.4%. The half-year and quarterly figures therefore show different shifts in the customer-industry mix.
What do ESDS's operating and return metrics show?
ESDS reported a debt-to-equity ratio of 0.0 times in H1FY27, compared with 0.1 times in H1FY26, while its debt service coverage ratio increased to 6.7 times from 6.2 times. The company operated five data centres in both periods. H1FY27 total income was Rs 278.82 crore, including Rs 6.83 crore of other income.
Days sales outstanding, or DSO, rose to 81 days in H1FY27 from 69 days in H1FY26. Q2FY27 DSO was 82 days, lower than 87 days in Q1FY27 but above 81 days in Q2FY26. ESDS uses revenue from operations, rather than total income, as the denominator for its expense-ratio disclosures.
Return on equity, or ROE, was 6.6% in H1FY27, compared with 10.8% in H1FY26, while return on capital employed, or ROCE, was 6.2%, compared with 14.0%. For Q2FY27, ESDS reported ROE of 6.6% and ROCE of 6.2%, and noted that quarterly return ratios for the quarter ended September 30, 2026 were not annualised.
Conclusion
ESDS increased H1FY27 revenue and profit, but its cost base expanded more rapidly than revenue. Revenue from operations rose by Rs 53.62 crore and profit after tax increased by Rs 12.58 crore, while the EBITDA margin declined 456 basis points. The Rs 2.34 crore IPO marketing charge affected Q2FY27 and half-year reported profit before tax, alongside the 55.5% rise in other expenses.
The next reported periods will show whether other expenses moderate after the Q2FY27 IPO marketing charge and whether the IaaS share, which reached 50.1% in H1FY27, continues to increase. Investors can also track DSO after its rise to 81 days and the return ratios after H1FY27 ROE and ROCE declined to 6.6% and 6.2%, respectively.