










Gini & Jony distributors account for 42% of channel revenue
Key highlights
- Distributors account for 42% of Gini & Jony’s disclosed channel revenue mix, versus 25% for e-commerce.
- Gini & Jony had 56 EBOs across 16 states as of Q2-FY27.
- Gini & Jony reported 49 factory outlets, 168 shop-in-shop locations and 237 mom-n-pop stores as of Q2-FY27.
- Online represented 30% of Gini & Jony retail revenue in H1-FY27 on a pan-India basis.
powered by IRIS
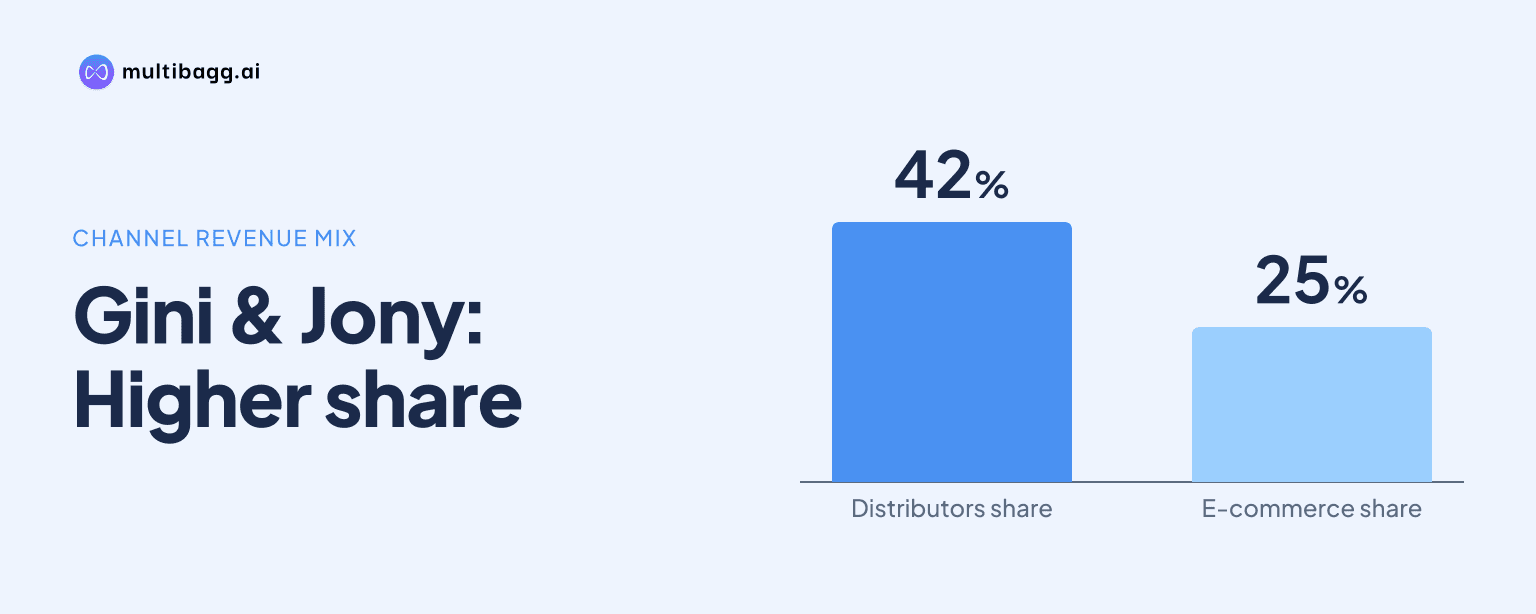
Gini & Jony identifies distributors as its largest revenue channel at 42%, ahead of e-commerce at 25%, in its disclosed channel mix. As of Q2-FY27, the brand also reported 56 exclusive brand outlets, 49 factory outlets, 168 shop-in-shop locations and 237 mom-n-pop stores.
Know Suditi Industries inside out
Results, valuation, peers and who's buying, in one view.
How is Gini & Jony revenue divided by channel?
Distributors are Gini & Jony’s largest disclosed channel, contributing 42% of revenue. E-commerce is second at 25%, followed by multi-brand outlets (MBOs) at 19%, factory outlets at 8% and exclusive brand outlets (EBOs) at 6%.
The five channel shares total 100%, allocating the disclosed revenue mix between distribution partners, online channels and physical retail. Distributors exceed e-commerce by 17 percentage points, while the 42% distributor share is 28 percentage points above the combined 14% contribution from factory outlets and EBOs.
MBOs contribute 19%, or 13 percentage points more than EBOs at 6%. The presentation’s distribution process places warehousing after multistage quality checks and before omnichannel sales through EBOs, MBOs, mom-n-pop stores and e-commerce marketplaces including Myntra and AJIO.
Which Gini & Jony routes contribute more than dedicated stores?
Distributors, e-commerce and MBOs together contribute 86% of Gini & Jony’s disclosed revenue mix, compared with 14% from factory outlets and EBOs combined. This comparison shows that the reported mix is weighted toward third-party distribution, online sales and multi-brand retail rather than dedicated outlets.
E-commerce’s 25% share is supported by a presence on AJIO, cocoblu and TATA CliQ Fashion, according to the network page. Gini & Jony also reported Myntra sales of Rs 1 crore as of Q2-FY27, although the presentation does not disclose the period covered by that Myntra sales figure.
The presentation reports 56 EBOs, 49 factory outlets, 16 large-format stores (LFS), 168 shop-in-shop (SIS) locations and 237 mom-n-pop stores as of Q2-FY27. A separate business-overview page refers to 233 multi-brand stores across more than 100 cities, but does not reconcile that count with the LFS, SIS and mom-n-pop categories.
Got a follow-up? Ask IRIS
How extensive is Gini & Jony’s store network?
Gini & Jony operated across 16 states with 56 EBOs as of Q2-FY27. Its EBO base comprised 21 company-owned, franchise-operated (COFO) stores, 30 franchise-owned, franchise-operated (FOFO) stores and five company-owned, company-operated (COCO) stores.
The 21 COFO and 30 FOFO locations total 51 of the 56 EBOs, leaving five COCO outlets. Gujarat and Bihar each had eight EBOs, the highest disclosed state count, followed by Assam with six and Uttar Pradesh and West Bengal with five each.
Rajasthan and Jharkhand each had four EBOs, while Maharashtra and Odisha each had three. Madhya Pradesh and Arunachal Pradesh had two each; Haryana, Karnataka, Sikkim, Tripura and Mizoram had one each. The source also lists new EBO launches at Pacific Mall in Jaipur, Phoenix Marketcity in Mumbai, Surat, Boulevard in Noida and Hubbali in Karnataka.
What do Gini & Jony’s regional and customer mixes show?
Gini & Jony reported online revenue of 30% of retail revenue in H1-FY27, while East contributed 22%, West 21%, North 18% and South 9%. The presentation records online revenue on a pan-India basis, making the 30% regional presentation different in stated scope from the 25% e-commerce share in the channel-mix table.
The five H1-FY27 regional categories total 100%. Online’s 30% was ahead of every individual offline region, while East’s 22% exceeded South’s 9% by 13 percentage points and North plus West accounted for 39%.
Boys’ products generated 68% of the disclosed customer revenue mix, compared with 29% for girls and 3% for baby. Average selling price (ASP) was Rs 628 for boys, Rs 556 for girls and Rs 405 for baby, putting the boys’ ASP Rs 72 above girls’ and Rs 223 above baby.
Top wear was the largest product category in H1-FY27 at 44% of revenue, followed by bottom wear at 33% and heavy winter at 14%. Dresses and winter wear each represented 4%, while accessories were 2%; their listed ASPs ranged from Rs 495 for top wear to Rs 3,722 for accessories.
Conclusion
Gini & Jony’s reported channel mix places distributors at the centre of revenue generation, with a 42% share that exceeds e-commerce’s 25%, MBOs’ 19% and the combined 14% from factory outlets and EBOs. The 86% combined contribution from distributors, e-commerce and MBOs indicates that the disclosed sales base extends beyond the 56 dedicated EBOs across 16 states.
What to watch next is the performance of the five named EBO launches in Jaipur, Mumbai, Surat, Noida and Hubbali, for which the presentation gives no store-level sales target. Management also describes artificial intelligence and machine learning forecasting by store, style, size and colour, plus allocation and replenishment based on sales velocity, with intended outcomes including fewer returns, lower write-offs and reduced working-capital days.