










Glass Wall Systems FY26 revenue rose to Rs 457 crore, margin fell
Key highlights
- Glass Wall Systems reported FY26 revenue of Rs 457.0 crore, compared with Rs 278.3 crore in FY25.
- Glass Wall Systems’ FY26 EBITDA was Rs 105.2 crore, while EBITDA margin declined to 23.0% from 26.2%.
- Glass Wall Systems’ FY26 profit after tax increased to Rs 83.8 crore, while its margin fell to 18.3% from 20.7%.
- Glass Wall Systems generated Rs 73.3 crore of FY26 operating cash, while March 2026 trade receivables reached Rs 109.0 crore.
powered by IRIS
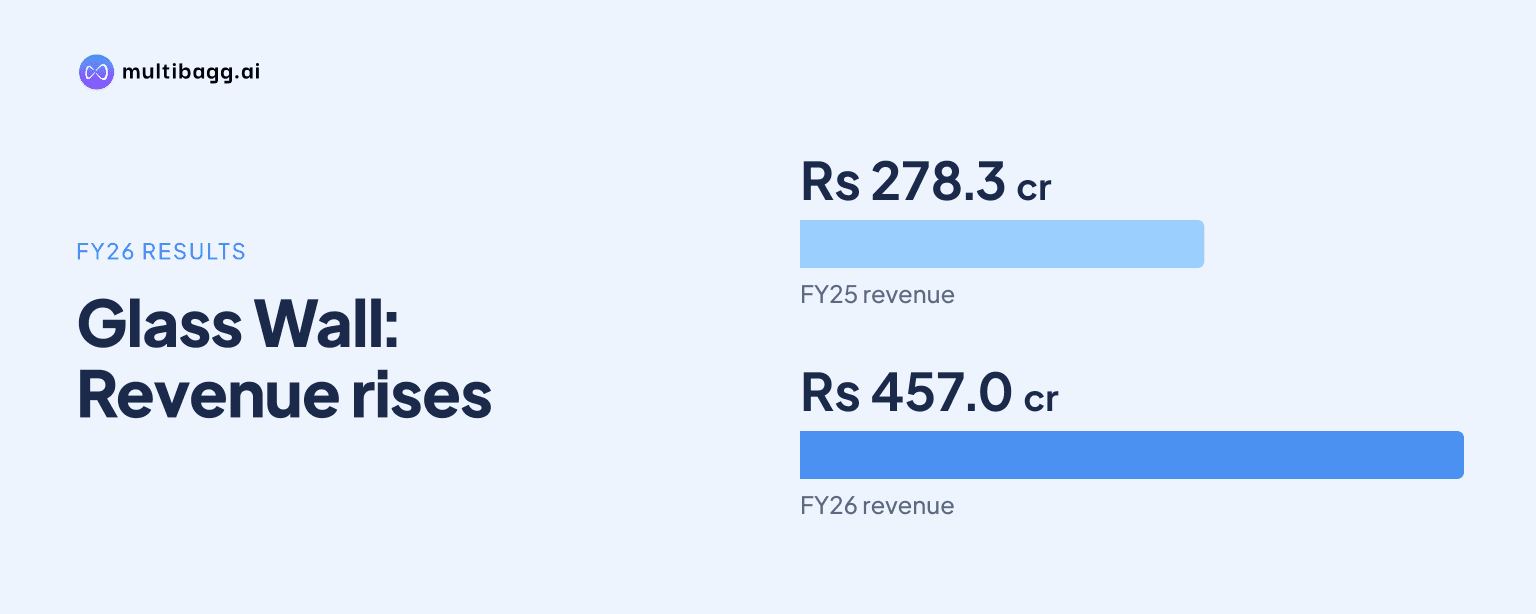
In FY26, Glass Wall Systems recorded revenue from operations of Rs 457.0 crore, up from Rs 278.3 crore in FY25, while its earnings before interest, tax, depreciation and amortisation (EBITDA) margin fell to 23.0% from 26.2%. EBITDA nevertheless increased to Rs 105.2 crore and profit after tax reached Rs 83.8 crore.
Know Glass Wall Systems (India) inside out
Results, valuation, peers and who's buying, in one view.
How did Glass Wall Systems revenue change in FY26?
Glass Wall Systems increased revenue from operations by Rs 178.7 crore to Rs 457.0 crore in FY26 from Rs 278.3 crore in FY25. This followed a Rs 26.0 crore decline in FY25 from Rs 304.3 crore in FY24. The historical-financial summary rounds the three revenue figures to Rs 304 crore, Rs 278 crore and Rs 457 crore, respectively.
Gross profit rose to Rs 236.2 crore in FY26 from Rs 148.9 crore in FY25, as cost of goods sold increased to Rs 220.8 crore from Rs 129.4 crore. Gross profit margin declined to 51.7% in FY26 from 53.5% in FY25, but remained above the 49.3% recorded in FY24. Revenue growth in FY26 therefore coincided with a lower gross margin than in the prior year.
Why did Glass Wall Systems EBITDA margin fall in FY26?
Glass Wall Systems does not state a specific operational reason for the FY26 EBITDA-margin decline, but its financial statement records higher cost lines alongside the margin movement. EBITDA rose by Rs 32.2 crore to Rs 105.2 crore from Rs 73.0 crore, while EBITDA margin decreased by 3.2 percentage points to 23.0% from 26.2%.
Employee cost increased to Rs 37.7 crore in FY26 from Rs 29.0 crore in FY25, and other expenses rose to Rs 93.2 crore from Rs 46.9 crore. In FY24, employee cost was Rs 26.3 crore and other expenses were Rs 68.9 crore. The presentation shows these cost movements but does not break other expenses into underlying categories.
The three-year margin record was uneven. Gross profit margin increased by 4.2 percentage points from 49.3% in FY24 to 53.5% in FY25, before declining by 1.8 percentage points in FY26. EBITDA margin similarly rose from 18.0% in FY24 to 26.2% in FY25, then fell to 23.0% even as FY26 EBITDA was the highest of the three years.
How did Glass Wall Systems profit develop over three years?
Glass Wall Systems reported profit after tax of Rs 83.8 crore in FY26, compared with Rs 57.5 crore in FY25 and Rs 20.3 crore in FY24. Its profit-after-tax margin was 18.3% in FY26, down from 20.7% in FY25 but above 6.7% in FY24. Profit before tax increased to Rs 111.1 crore from Rs 75.6 crore, while the related margin declined to 24.3% from 27.2%.
The FY24 profit comparison requires distinction between reported and adjusted figures. The profit-and-loss statement reports FY24 profit after tax of Rs 20.3 crore, whereas the historical summary shows adjusted profit after tax of Rs 36 crore. The adjustment adds back a Rs 16.2 crore one-time expense for a fully provided advance given for properties; no exceptional item is shown for FY25 or FY26.
Finance cost edged down to Rs 3.5 crore in FY26 from Rs 3.6 crore in FY25, while other income increased to Rs 14.5 crore from Rs 9.8 crore. Tax expense rose to Rs 27.3 crore from Rs 18.1 crore. Earnings per share increased to Rs 9.90 in FY26 from Rs 6.21 in FY25 and Rs 1.81 in FY24.
Got a follow-up? Ask IRIS
Did Glass Wall Systems convert FY26 profit into operating cash?
Glass Wall Systems generated net cash from operating activities of Rs 73.3 crore in FY26, almost unchanged from Rs 73.0 crore in FY25, despite profit before tax rising by Rs 35.5 crore. Cash generated from operations before direct taxes increased to Rs 95.7 crore from Rs 78.1 crore, while direct taxes paid increased to Rs 22.4 crore from Rs 5.1 crore.
Working-capital changes used Rs 17.7 crore in FY26, compared with a Rs 2.6 crore addition in FY25. Operating profit before working-capital changes was Rs 113.4 crore in FY26, up from Rs 75.5 crore a year earlier. Net cash from operating activities had increased from Rs 42.7 crore in FY24 to Rs 73.0 crore in FY25 before remaining broadly unchanged in FY26.
Cash and cash equivalents ended FY26 at Rs 32.5 crore, compared with Rs 2.6 crore at the end of FY25 and Rs 8.3 crore at the end of FY24. The FY26 cash-flow statement records net investing cash outflow of Rs 38.8 crore and net financing cash outflow of Rs 5.3 crore, alongside a Rs 29.1 crore net increase in cash and cash equivalents.
What do Glass Wall Systems balance-sheet and return figures show?
Glass Wall Systems reported adjusted return on capital employed of 55% in FY26, versus 66% in FY25 and 45% in FY24. The presentation defines this measure as adjusted earnings before interest and tax divided by adjusted capital employed. Return on equity was 39% in both FY25 and FY26, following 18% in FY24.
Total assets rose to Rs 468.4 crore in March 2026 from Rs 316.6 crore in March 2025, while total equity increased to Rs 259.9 crore from Rs 174.1 crore. Property, plant and equipment rose to Rs 66.1 crore from Rs 41.4 crore, and other non-current financial assets increased to Rs 45.6 crore from Rs 1.7 crore.
Trade receivables increased to Rs 109.0 crore in March 2026 from Rs 50.8 crore a year earlier. Current trade payables also rose to Rs 65.5 crore from Rs 37.8 crore. Combined current and non-current borrowings were Rs 6.6 crore in March 2026, compared with Rs 8.4 crore in March 2025.
Conclusion
Glass Wall Systems’ FY26 record shows revenue recovering sharply from the FY25 decline, with revenue reaching Rs 457.0 crore and EBITDA reaching Rs 105.2 crore. Profit after tax rose to Rs 83.8 crore, but gross profit margin, EBITDA margin, profit-before-tax margin and profit-after-tax margin were all below their FY25 levels.
The next financial disclosure will need to clarify cash conversion as working-capital changes used Rs 17.7 crore in FY26 and trade receivables reached Rs 109.0 crore in March 2026. Glass Wall Systems disclosed no forward revenue, margin or cash-flow target in this historical-financial record.