










Glottis sea exports reach 42% in Q2 FY27 revenue mix
Key highlights
- Sea exports contributed 42% of Glottis Q2 FY27 revenue, up from 12% in Q2 FY26.
- Sea imports remained Glottis’s largest segment at 50% of Q2 FY27 revenue, down from 81%.
- Glottis Q2 FY27 revenue rose 28.8% year on year to Rs 276.5 crore, while EBITDA margin was 1.2%.
- Renewable energy fell to 16% of Q2 FY27 revenue from 46%, while the top five customers accounted for 33% versus 41%.
powered by IRIS
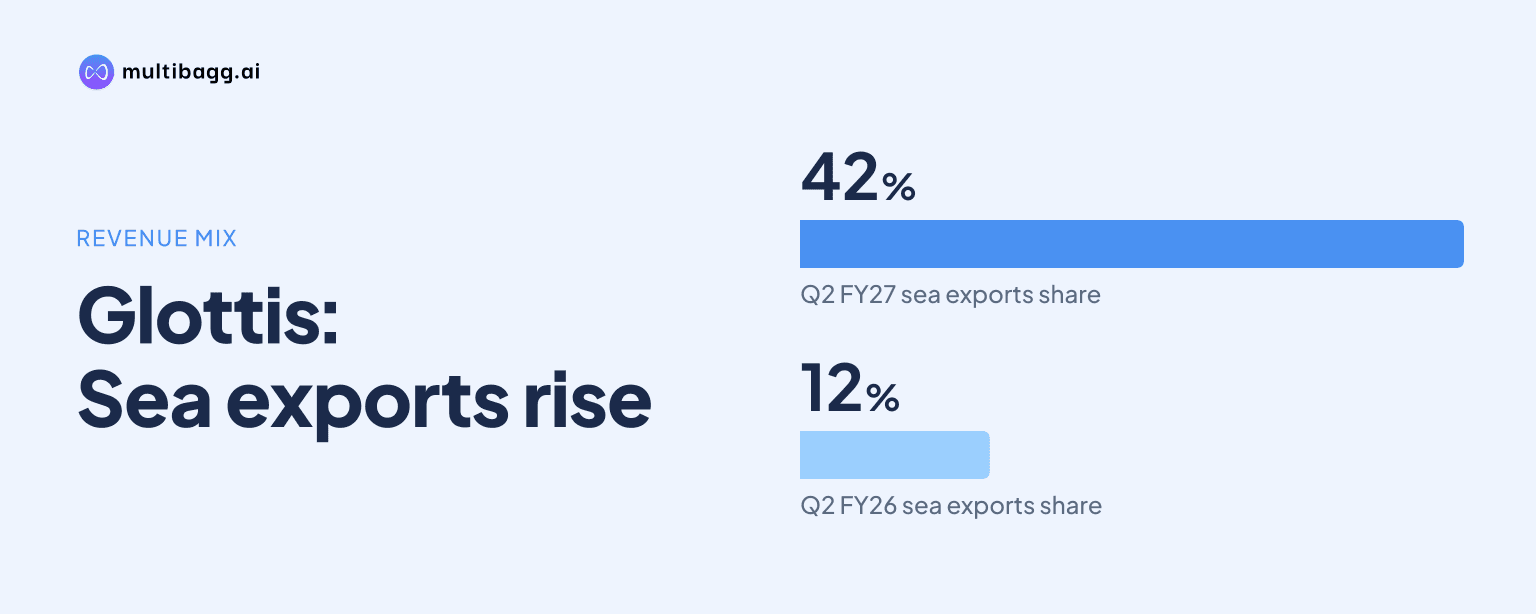
Glottis Ltd shifted its Q2 FY27 revenue mix toward sea exports, which rose to 42% of revenue from 12% in Q2 FY26 after segment revenue increased 344.4% year on year. Sea imports remained Glottis’s largest vertical at 50%, but their contribution fell sharply from 81% a year earlier.
Know Glottis inside out
Results, valuation, peers and who's buying, in one view.
How did Glottis’s Q2 FY27 segment mix change?
Glottis’s principal Q2 FY27 change was a 30-percentage-point increase in sea exports’ revenue share to 42%, alongside a 31-percentage-point reduction in sea imports’ share to 50%. Management said it placed greater emphasis on export-led business during a quarter in which revenue from operations reached Rs 276.5 crore, up 28.8% year on year and 17.9% quarter on quarter.
The company’s sea-export revenue grew 344.4% year on year, while sea import continued to account for half of Q2 FY27 revenue. The remaining mix was comparatively small: air-freight import and air-freight export each represented 3%, road transport represented 2%, and warehousing was recorded at 0%. Management also reported air-import revenue growth of 68.9% and air-export revenue growth of 420% year on year.
The shift did not remove Glottis’s dependence on ocean freight, because ocean imports and exports together made up 92% of Q2 FY27 revenue. It did, however, make the two ocean businesses far closer in scale than in Q2 FY26, when imports outweighed exports by 69 percentage points. This comparison is based on revenue contribution, not shipment volumes or margins by segment, which the presentation does not disclose.
What does the H1 FY27 mix say about the quarterly shift?
Glottis’s H1 FY27 revenue mix shows that sea exports contributed 32%, below the 42% reached in Q2, while sea imports contributed 59%, above the quarter’s 50%. This indicates that the export weighting was more pronounced in Q2 than in the first half overall, even as imports remained the leading H1 business vertical.
Revenue from operations in H1 FY27 was Rs 511 crore, compared with Rs 382.9 crore in H1 FY26, an increase of Rs 128.1 crore. Across the half year, air-freight import and export each contributed 3%, road transport contributed 3%, and warehousing contributed 0%. Thus, the H1 and Q2 data both show an ocean-led model, but Q2 carried a substantially higher export share.
Volume data in the presentation relate specifically to ocean imports rather than exports. Glottis handled 43,216 twenty-foot equivalent units, or TEUs, of ocean imports in H1 FY27, compared with 89,098 TEUs in FY26. That measure provides context for the continuing importance of imports, but it cannot establish export volumes because the company did not provide a corresponding export-TEU figure.
Got a follow-up? Ask IRIS
How did Glottis diversify customers and industries?
Glottis reduced its top-five-customer revenue concentration to 33% in Q2 FY27 from 41% in Q2 FY26, according to management. It also changed its industry mix: renewable energy declined to 16% of Q2 revenue from 46%, while logistics rose to 20% from 4% and home appliances rose to 18% from 11%.
The Q2 FY27 industry distribution placed logistics first at 20%, home appliances second at 18%, and renewable energy third at 16%. Engineering products accounted for 10%, chemicals 7%, agro products 6%, and other industries 22%. The movement in renewable energy was particularly material because that sector had represented 41% of Glottis’s FY26 revenue, according to the company’s investment-case presentation.
In H1 FY27, renewable energy was still the largest named industry at 26%, followed by logistics at 15% and home appliances at 14%. The top five customers represented about 26% of H1 revenue, below the 33% reported for Q2. These period-specific measures show that the customer and industry patterns in the quarter did not exactly match those across the first half.
What was the financial effect of the Q2 business mix?
Glottis reported Q2 FY27 earnings before interest, tax, depreciation and amortisation, or EBITDA, of Rs 3.4 crore and an EBITDA margin of 1.2%, versus Rs 18.1 crore and 8.4% in Q2 FY26. Management attributed the quarter’s profitability outcome to changes in business mix, freight realisations and operating costs.
Revenue increased by Rs 61.8 crore from Q2 FY26 to Q2 FY27, while EBITDA declined by Rs 14.7 crore over the same comparison. Profit after tax, or PAT, moved from Rs 12.4 crore in Q2 FY26 to a Rs 20 lakh loss in Q2 FY27. The presentation notes that EBITDA excludes other income, so the stated margin comparison is on that basis.
For H1 FY27, EBITDA was Rs 19.6 crore, down from Rs 35 crore in H1 FY26, and the EBITDA margin fell to 3.8% from 9.2%. H1 PAT was Rs 10.7 crore, compared with Rs 24.3 crore a year earlier. Management said its priorities were improving shipment-level profitability, managing operating costs and maintaining working-capital discipline while expanding business.
Conclusion
Glottis’s Q2 FY27 results show a material rebalancing within its ocean-freight operations: sea exports rose from 12% to 42% of revenue, while sea imports fell from 81% to 50%. The company also reported lower dependence on renewable energy and its five largest customers, but the period of faster revenue growth coincided with EBITDA margin declining from 8.4% to 1.2%.
What to watch next is execution of management’s FY27 operating-capability plan. After adding trailers in Q1 FY27, Glottis said container deployment was planned to begin in Q3 FY27 and that it intended to complete its planned FY27 capital-expenditure programme using initial public offering proceeds. Management also identified shipment profitability, existing-customer business and working capital as priorities.