










Gopal Snacks’ wafers rise 40% as other states expand 94%
Key highlights
- Gopal Snacks’ Wafers revenue rose 40.0% year on year to Rs 58.0 crore in Q2 FY27.
- Revenue from other states increased 94.0% year on year to Rs 23.6 crore in Q2 FY27.
- Focus-state revenue rose 34.7% to Rs 131.7 crore and its dealer network reached 616.
- Gopal Snacks’ Q2 FY27 EBITDA increased 72.3% to Rs 41.6 crore, with margin reaching 9.0%.
powered by IRIS
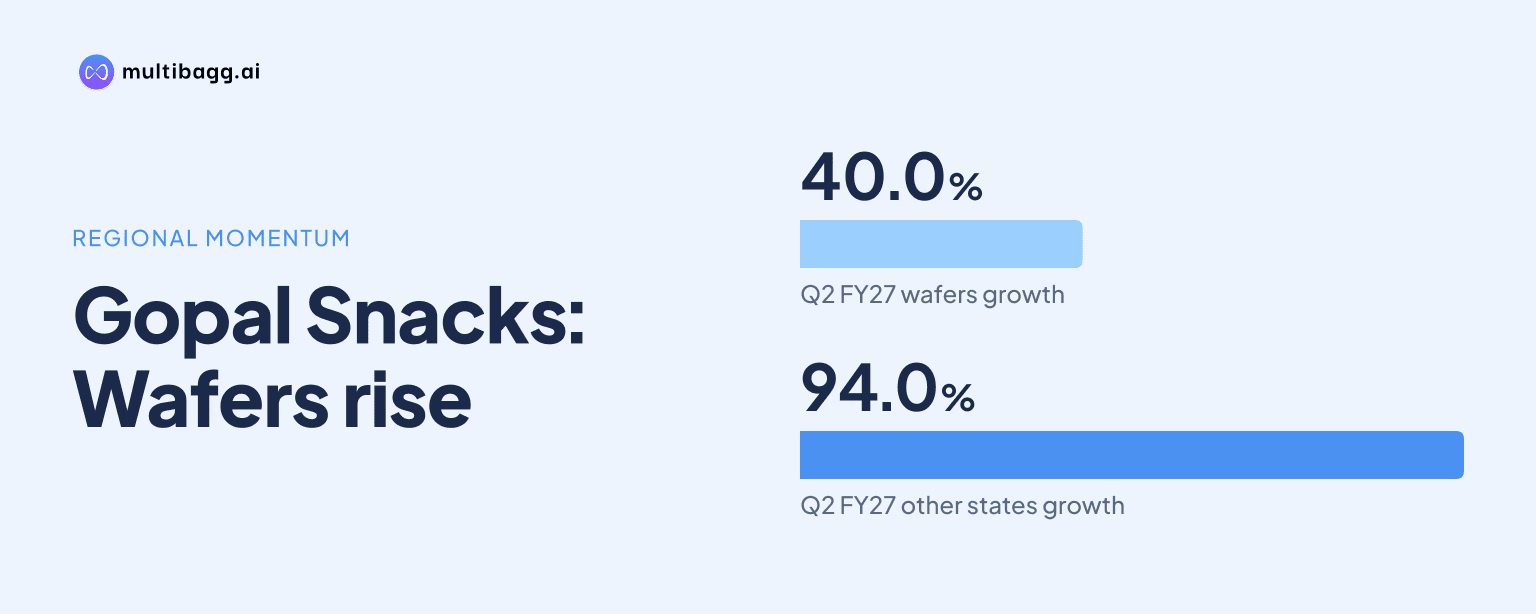
In the second quarter of fiscal year 2027 (Q2 FY27), Gopal Snacks reported Rs 58.0 crore of Wafers revenue, up 40.0% year on year, while other-states revenue rose 94.0% to Rs 23.6 crore. Total revenue from operations increased 22.9% to Rs 461.5 crore, showing growth beyond Gathiya and core states.
Know Gopal Snacks inside out
Results, valuation, peers and who's buying, in one view.
Which snack segments drove Gopal Snacks’ Q2 FY27 growth?
Gopal Snacks’ Wafers revenue increased 40.0% year on year to Rs 58.0 crore in Q2 FY27 from Rs 41.4 crore in Q2 FY26. Wafer volume rose 39.7% to 2,681 metric tonnes (MT), compared with 1,918 MT a year earlier. The reported revenue and volume growth rates were closely aligned in the quarter.
Other Snacks Products recorded the highest revenue growth rate among the disclosed segments, rising 71.4% to Rs 24.9 crore from Rs 14.5 crore, while volume increased 18.2% to 2,920 MT. Gopal Snacks defines this category as mainly noodles, rusk, wafer biscuit, wafer roll and washing bar. Its growth came from a smaller base than Wafers, which added Rs 16.6 crore of revenue year on year.
Gathiya remained the largest disclosed segment by Q2 FY27 revenue at Rs 123.1 crore, followed by Namkeen at Rs 105.0 crore and Pellets and Extruded Snacks at Rs 80.9 crore. Gathiya revenue grew 25.6% year on year, ahead of Namkeen’s 14.5% growth, while its volume rose 11.1% to 7,159 MT. Sequentially, Gathiya revenue rose 2% from Rs 120.8 crore in Q1 FY27, compared with 20% growth in Wafers from Rs 48.1 crore.
How did Gopal Snacks’ revenue change across markets?
Focus states and other states grew faster than core states for Gopal Snacks in Q2 FY27. Focus-state revenue rose 34.7% year on year to Rs 131.7 crore, and other-states revenue increased 94.0% to Rs 23.6 crore. Core-state revenue was still the largest geographic pool at Rs 276.5 crore, but its year-on-year growth was 15.5%.
The dealer count expanded principally in focus states, where the network rose to 616 dealers in Q2 FY27 from 448 a year earlier, an increase of 37.5%. Other states increased to 130 dealers from 99, while core states remained unchanged at 311 dealers. Sequentially, focus-state revenue grew 15% from Rs 114.2 crore in Q1 FY27, ahead of 3% growth in core states and 17% growth in other states.
Gopal Snacks’ Q2 FY27 geography mix placed core states at 60.0% of revenue and focus states at 28.5%, with other states at 5.1%. Exports accounted for 0.2%, while others represented 6.2%. The disclosed market data show that newer geographies contributed a smaller share than core states but delivered higher reported growth rates during the quarter.
Got a follow-up? Ask IRIS
What does Gopal Snacks’ mix show about price points and categories?
Gopal Snacks generated 59.6% of Q2 FY27 revenue from the Rs 5 price point, making it the largest disclosed price band. Products priced above Rs 10 represented 21.3% of revenue, while the Rs 10 price point contributed 12.9% and others accounted for 6.2%. The presentation does not allocate individual product categories to these price bands.
By segment mix, Gathiya represented 26.7% of Q2 FY27 revenue and Namkeen represented 22.8%, together accounting for 49.5%. Snack Pellets made up 15.5%, Wafers 12.6%, Papad, Spice and Besan 8.9%, Other Products 5.4%, Extruded Snacks 2.1%, and others 6.2%. Wafers’ 12.6% mix share was below Gathiya’s share despite its 40.0% revenue growth rate.
The presentation also reports quarter-on-quarter growth of 7% and 17% alongside the price-point mix, without assigning those growth figures to named price bands on the supplied page. The disclosed Q2 FY27 category figures show revenue of Rs 58.0 crore for Wafers, compared with Rs 123.1 crore for Gathiya. This identifies a faster-growing category that remained smaller than Gathiya in the quarter.
Did Gopal Snacks’ growth coincide with higher profitability?
Gopal Snacks’ total revenue from operations rose 22.9% year on year to Rs 461.5 crore in Q2 FY27, while gross profit increased 26.1% to Rs 125.0 crore. Gross profit margin, excluding other income, increased to 27.1% from 26.4% in Q2 FY26. Operating revenue, excluding other operating income, grew 23.6% to Rs 457.3 crore.
Earnings before interest, tax, depreciation and amortisation (EBITDA), excluding other income, rose 72.3% to Rs 41.6 crore, and the EBITDA margin increased to 9.0% from 6.4%. Profit before tax before exceptional items rose 92.9% to Rs 25.9 crore, with its margin increasing from 3.6% to 5.6%. Raw-material costs increased 21.7% to Rs 336.5 crore, slower than total revenue growth.
Profit after tax was Rs 45.9 crore in Q2 FY27, up 78.5% from Rs 25.7 crore, and exceptional items were Rs 35.3 crore. For the first half of fiscal year 2027 (H1 FY27), revenue from operations increased 26.7% to Rs 883.9 crore, EBITDA rose 85.7% to Rs 73.1 crore, and profit after tax increased 108.0% to Rs 58.7 crore. These results provide the financial context for the segment and geography shifts reported in the quarter.
Conclusion
Gopal Snacks’ Q2 FY27 data show that Wafers and newer markets expanded faster than its established Gathiya and core-state businesses. Wafers added Rs 16.6 crore of year-on-year revenue, while focus states added Rs 33.9 crore and other states added Rs 11.4 crore. At the same time, Gathiya remained the largest disclosed product category and core states remained the largest geographic revenue source.
The next disclosed matters to watch are whether the 616-dealer focus-state network and 130-dealer other-state network continue to support revenue growth, and how the product mix develops against input movements. In Q2 FY27, the presentation’s palmolein oil index was 1.26 versus 1.00 in Q2 FY26, while the udad mogar and laminate indices were each 1.20.