










GRE FY27 EPC project capacity was 88% above the FY26 total
Key highlights
- GRE executed 65 EPC projects from April 2024 to October 2026.
- FY27 EPC capacity was 44,088.50 KWp across 23 projects, versus 23,506.04 KWp across 25 FY26 projects.
- GRE reported more than 197 MW of completed and ongoing solar EPC portfolio through October 2026.
- CAPEX operational revenue was Rs 128.9 crore in H1-FY27, compared with Rs 111.8 crore in FY26.
powered by IRIS
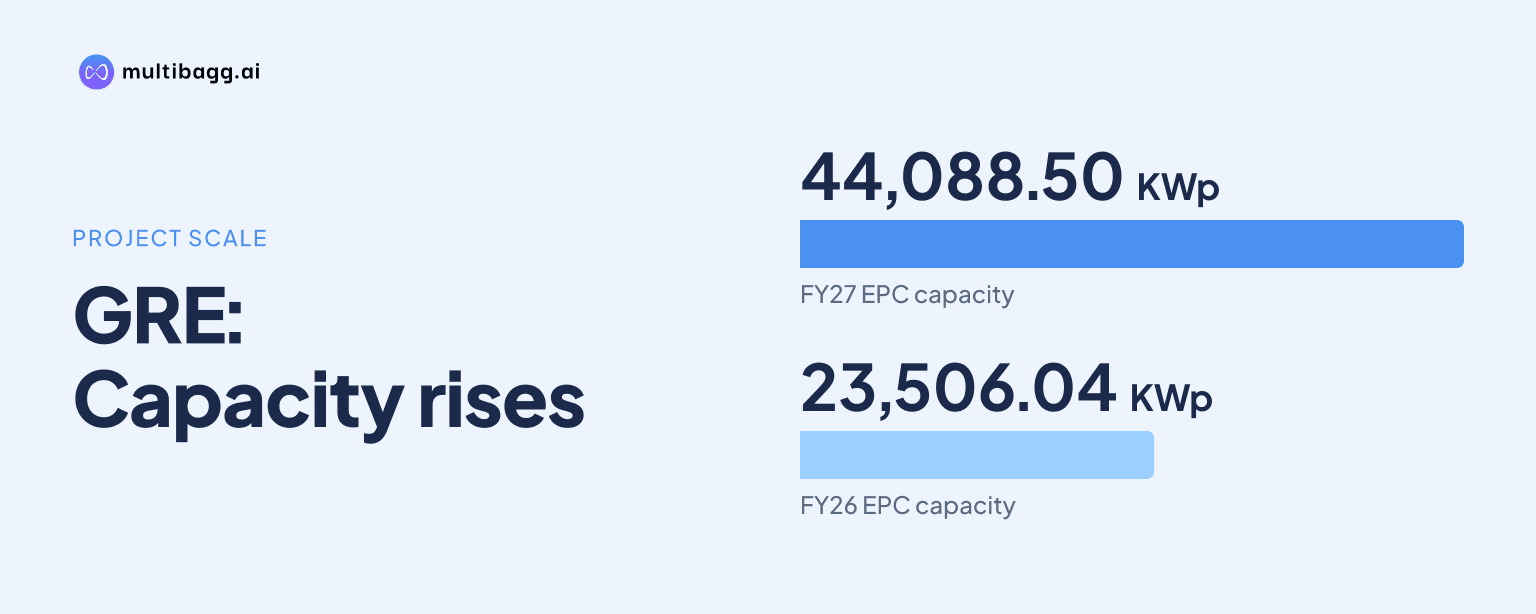
GRE reported 44,088.50 kilowatt-peak (KWp) of EPC capacity across 23 FY27 projects, 87.6% above the 23,506.04 KWp across 25 FY26 projects, according to its execution record through October 2026. GRE also reported 65 engineering, procurement and construction (EPC) projects executed between April 2024 and October 2026 and more than 197 megawatts (MW) of completed and ongoing EPC solar portfolio.
Know GRE Renew Enertech inside out
Results, valuation, peers and who's buying, in one view.
How much EPC execution has GRE reported?
GRE reported 65 EPC projects executed from April 2024 to October 2026. Its fiscal-year execution table lists 17 projects in FY25, 25 in FY26 and 23 in FY27, which together equal the stated 65 projects. The presentation separately places the cumulative completed-and-ongoing solar EPC portfolio at more than 197 MW through October 2026, spanning rooftop and ground-mounted installations.
The reported capacity increased in each year of the three-year project record, from 11,936.76 KWp in FY25 to 23,506.04 KWp in FY26 and 44,088.50 KWp in FY27. The project count rose from 17 to 25 between FY25 and FY26, then declined by two projects in FY27 while the listed capacity continued to rise.
Why was GRE’s FY27 capacity higher with fewer projects?
GRE’s FY27 capacity was higher because its 23 reported FY27 projects carried 44,088.50 KWp, compared with 23,506.04 KWp for 25 FY26 projects. That is an increase of 20,582.46 KWp, or 87.6%, even as the project count fell by 8%. The disclosed figures therefore point to a larger average project size in FY27 rather than to a higher number of individual projects.
On a calculation using GRE’s reported totals, average capacity per project rose from about 0.94 MWp in FY26 to about 1.92 MWp in FY27. FY25 projects averaged about 0.70 MWp from 11.93676 MWp across 17 projects. GRE does not disclose individual project capacities, contract values, or reasons for the FY27 shift in project-size mix, so the data do not establish the commercial terms behind the larger capacity total.
The FY25 table highlights Pragna Pharma Pvt. Ltd. and Pragna Dyechem Pvt. Ltd., while FY26 highlights Golf Ceramics and Uma Kraft Paper Pvt. Ltd. For FY27, GRE names Power High Engineers Pvt Ltd and Global Paper Industries Pvt Ltd. These are client highlights only: the presentation does not allocate the 44,088.50 KWp FY27 capacity among named customers or state the commissioning status of each project.
How does GRE’s EPC model earn revenue?
GRE’s capital expenditure (CAPEX) EPC model has customers finance and own the solar asset while GRE executes the project. The stated scope includes site survey, design, engineering, procurement, construction and grid-connected commissioning. GRE says revenue comes from EPC contracts and annual operations and maintenance (O&M) agreements, with power purchase agreement (PPA) management fees applicable to third-party non-captive projects.
CAPEX operational revenue increased from Rs 72.4 crore in FY24 to Rs 76.8 crore in FY25 and Rs 111.8 crore in FY26. It was Rs 128.9 crore in H1-FY27, exceeding the disclosed FY26 full-year figure by Rs 17.1 crore, although a half-year period is not directly comparable with a full financial year. The presentation does not match operational revenue to the 65 projects or disclose the revenue contribution of each fiscal-year capacity cohort.
GRE reported profit before interest and tax (PBIT) of Rs 12.8 crore in FY25, Rs 20.4 crore in FY26 and Rs 14 crore in H1-FY27. The FY26 PBIT increase of Rs 7.6 crore accompanied a Rs 35 crore increase in CAPEX operational revenue from FY25. The H1-FY27 PBIT figure remains a partial-period measure, and the presentation provides no project-level margin data.
Got a follow-up? Ask IRIS
What operating features support GRE’s EPC execution?
GRE operates captive and non-captive EPC project models and says that third-party and group-captive power-sale arrangements can generate recurring PPA management fees. In the CAPEX model, customers retain asset ownership, unlike GRE’s renewable energy service company (RESCO) model, where GRE invests in, owns and operates the plant. This distinction means the more than 197 MW EPC portfolio should not be treated as a GRE-owned power-generating asset base.
GRE also says it uses a remote monitoring and O&M platform to optimise plant performance and reduce customer downtime. Its presentation lists component and strategic partners including Waaree, Rayzon Solar, Vikram Solar, Adani Solar, C&S Electric, Siemens, Schneider Electric, Sungrow, Solis, Hitachi, Fimer, GoodWe, RR Kabel, Havells and KEI Wires & Cables. The presentation gives no procurement volumes, supplier contract values or supplier-specific project allocations.
How does GRE’s RESCO business differ from EPC?
GRE’s RESCO model differs from EPC because GRE funds, owns and operates solar assets while customers procure electricity under long-term PPAs. The presentation describes monthly tariff revenue of Rs 4 to Rs 6 per kilowatt-hour and refers to 25-year cash flows under the model. In contrast, EPC customers finance the asset and GRE earns execution, O&M and, where applicable, PPA management fees.
RESCO operational revenue rose from Rs 0.4 crore in FY25 to Rs 2.3 crore in FY26 and Rs 3.3 crore in H1-FY27. GRE reported a cumulative RESCO asset portfolio of 840 KWp in FY25 and 3,833 KWp in FY26, with an FY27 P figure of 15,525 KWp. The presentation states that the FY27 P figure includes 2,016 kWh from subsidiary GRE Green Assets, using the unit shown in the source.
GRE’s rooftop RESCO projects total 2,993 KWp across seven projects commissioned from April to October 2025, each with a stated 25-year PPA tenure and Rs 5.04 per kilowatt-hour tariff. Its listed ground-mounted RESCO projects total 12,532.80 KWp, including a 9,676.80 KWp Himmatnagar project commissioned on 27 May 2026. These RESCO figures are reported separately from GRE’s 65 EPC projects and more than 197 MW EPC portfolio.
Conclusion
GRE’s execution record shows a pronounced increase in listed EPC project capacity in FY27: 44.08850 MWp across 23 projects versus 23.50604 MWp across 25 projects in FY26. The capacity increase coincided with CAPEX operational revenue of Rs 128.9 crore in H1-FY27, compared with Rs 111.8 crore in FY26, but GRE does not disclose project-level values, margins or completion status to link capacity directly to earnings.
The next disclosed item to watch is GRE’s FY27 P RESCO cumulative asset portfolio of 15,525 KWp, compared with 3,833 KWp in FY26. For EPC, GRE’s future disclosures on how much of the more than 197 MW portfolio is completed, along with project values and the capacity mix following the 65 projects executed through October 2026, would clarify whether the larger FY27 project scale is continuing.