










Gretex Corporate Services Limited reports conflicting H1 figures
Key highlights
- Gretex's detailed H1 FY27 statement reports revenue of Rs 113.1 crore, versus Rs 75.6 crore on its trend page.
- Gretex reports H1 FY27 EBITDA of Rs 26.6 crore in the detailed table and Rs 9.7 crore in the trend table.
- Gretex reports H1 FY27 PAT of Rs 19.9 crore in the detailed table and Rs 7.2 crore in the trend table.
- Management states a target fund raise of about Rs 20,000 crore over the next three years through private-equity placements and IPOs.
powered by IRIS
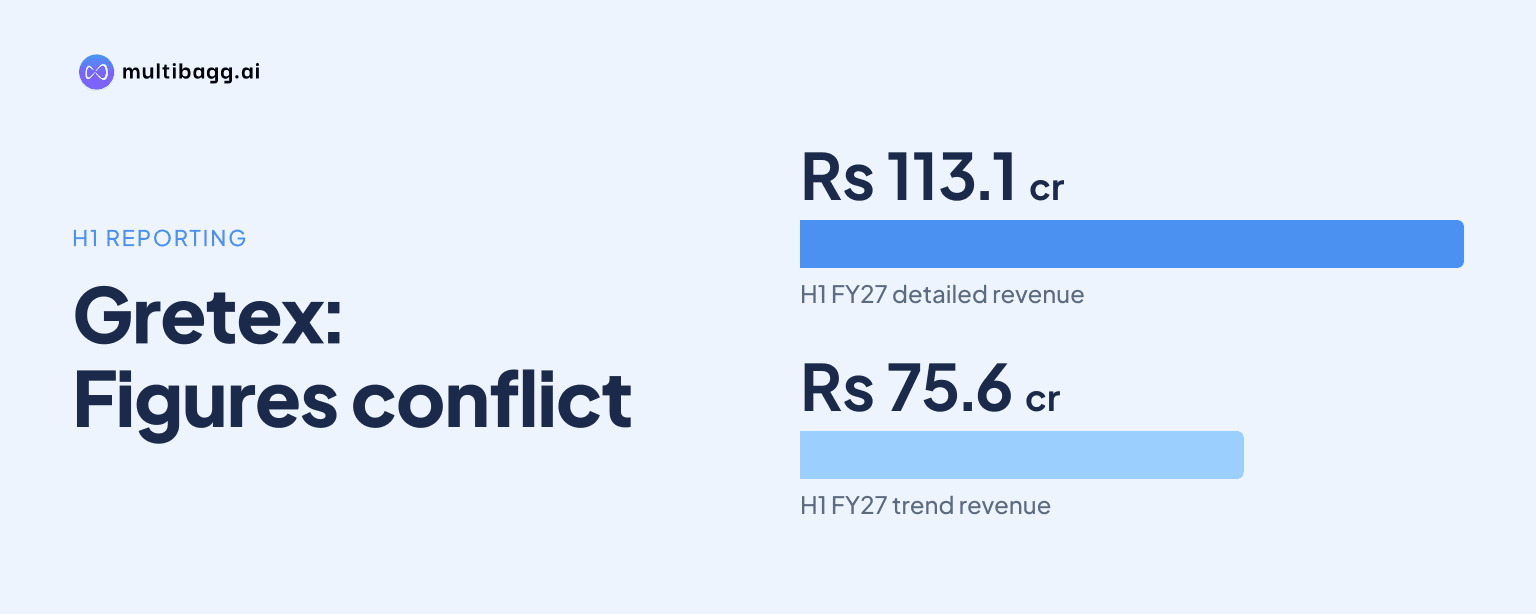
Gretex Corporate Services Limited presents conflicting consolidated H1 FY27 financial results: the detailed income statement reports revenue of Rs 113.1 crore, EBITDA of Rs 26.6 crore and PAT of Rs 19.9 crore, while the historical-performance page shows Rs 75.6 crore, Rs 9.7 crore and Rs 7.2 crore, respectively.
Know Gretex Corporate Services inside out
Results, valuation, peers and who's buying, in one view.
Why do Gretex's H1 FY27 figures conflict?
Gretex's investor presentation contains an unreconciled difference between its detailed consolidated income statement and its consolidated historical-performance table for H1 FY27. The detailed statement records revenue from operations of Rs 113.1 crore, compared with Rs 75.6 crore on the trend page, creating a Rs 37.5 crore gap for the same stated period.
The mismatch also covers earnings. The detailed H1 FY27 statement gives EBITDA, or earnings before interest, tax, depreciation and amortisation, of Rs 26.6 crore and profit after tax, or PAT, of Rs 19.9 crore; the trend page gives EBITDA of Rs 9.7 crore and PAT of Rs 7.2 crore. The differences are Rs 16.9 crore for EBITDA and Rs 12.7 crore for PAT.
Both tables describe the results as consolidated and use H1 FY27 as the period label. The detailed table is headed as consolidated financials for FY24 to FY26 despite displaying FY25, FY26 and H1-FY27 columns, while the trend table is headed as consolidated revenue, EBITDA and PAT trends. Neither table supplies a reconciliation, restatement note or explanation of a different consolidation scope.
What does each Gretex table report for H1 FY27?
Gretex's detailed statement reports higher H1 FY27 operating figures than its historical-performance table. The comparison below converts Indian rupee million figures in the presentation into Rs crore.
Gretex also reports different margins alongside the two datasets. The detailed statement shows an H1 FY27 EBITDA margin of 23.52% and PAT margin of 17.60%, whereas the trend page shows 12.83% and 9.52%, respectively. Each margin set corresponds mathematically with the revenue and profit figures shown in its own table.
The detailed statement provides line items not included in the trend table. It records Rs 1.5 crore of other income, Rs 1.1 crore of depreciation, Rs 0.7 crore of finance cost, Rs 0.5 crore as share of profit of associates and Rs 6.9 crore of taxes for H1 FY27. Those items lead from Rs 26.6 crore of EBITDA to Rs 19.9 crore of PAT, but the trend page provides no comparable bridge.
Are Gretex's earlier figures consistent across the two tables?
Gretex's FY25 results are consistent across the two tables, unlike the H1 FY27 data. Both show FY25 revenue of Rs 258.9 crore, EBITDA of Rs 1.3 crore and PAT of Rs 1.8 crore, with EBITDA margin of 0.50% and PAT margin of 0.70%.
FY26 revenue is also identical at Rs 178.5 crore, but the two tables differ modestly on profits. The detailed statement reports FY26 EBITDA of Rs 42.8 crore and PAT of Rs 27.9 crore, while the trend page reports Rs 42.7 crore and Rs 27.6 crore. The related EBITDA margins are 23.98% and 23.92%, while PAT margins are 15.63% and 15.46%.
The H1 FY27 differences are materially larger than the FY26 variations. The Rs 37.5 crore H1 revenue gap is about one-third of the Rs 113.1 crore reported in the detailed table, while the FY26 revenue figure does not change between the two pages. The presentation does not state whether the smaller FY26 differences and larger H1 FY27 discrepancies have a common cause.
Got a follow-up? Ask IRIS
What related H1 FY27 figures does Gretex disclose?
Gretex's H1 FY27 cash-flow statement appears with the detailed income statement series and reports Rs 31 crore of net cash inflow from operating activities. It also shows Rs 33.9 crore of investing cash outflow and Rs 5.2 crore of financing cash inflow, resulting in a Rs 2.3 crore net increase in cash and cash equivalents.
The H1-FY27 balance sheet reports total assets and total equity and liabilities of Rs 334.9 crore. Its assets include Rs 148.8 crore of financial assets, Rs 91.3 crore of inventories, Rs 48.5 crore of loans, Rs 10.4 crore of trade receivables and Rs 3.7 crore of cash and cash equivalents. These balance-sheet figures do not identify which revenue and profit series applies.
Gretex's detailed H1 FY27 income statement also shows profit before tax of Rs 26.8 crore and taxes of Rs 6.9 crore. The trend page, by contrast, starts with revenue and ends with EBITDA and PAT without reporting other income, depreciation, finance cost, tax or associate-profit items. The supplied presentation therefore does not establish which H1 FY27 series should be used as the comparable basis against FY26.
What should readers watch in Gretex's next disclosures?
Gretex's next relevant disclosure would be a correction or reconciliation explaining the difference between Rs 113.1 crore and Rs 75.6 crore of H1 FY27 revenue. Such an explanation would also need to address the two reported EBITDA figures of Rs 26.6 crore and Rs 9.7 crore, and the two PAT figures of Rs 19.9 crore and Rs 7.2 crore.
Management outlines several growth initiatives for which a clear reporting baseline would matter. These include larger mainboard initial public offering mandates, institutional broking using the GSBL market-making platform, a Category II alternative investment fund registration received by partner company Bahutex, and the acquisition of PlatinumOne Insurance Broking Pvt. Ltd. for insurance broking facilities.
Management also states a target to raise about Rs 20,000 crore over the next three years through private-equity placements and initial public offerings. The deck says GSBL opened a Navrangpura, Ahmedabad branch in line with the subsidiary's business requirements and expansion plans, but it does not disclose a target contribution from that branch or the other initiatives to consolidated revenue.
Conclusion
The presentation's two H1 FY27 consolidated financial tables cannot be read as one consistent results series. They agree on the period and consolidated label but produce different revenue, EBITDA, PAT and margin outcomes, while FY25 is aligned and FY26 contains smaller differences in EBITDA and PAT. The more detailed statement supplies a profit bridge, but it does not reconcile the lower trend-page figures.
The next point to watch is whether Gretex issues a clarification or amended presentation before either H1 FY27 series is used as a baseline for management's approximately Rs 20,000 crore, three-year fundraising target. Readers can also monitor disclosures on larger mainboard mandates, GSBL institutional broking, the Category II alternative investment fund platform and insurance broking for clearer reporting of their consolidated financial effect.