










Happy Forgings funded 92% of FY21-FY26 capex from cash flows
Key highlights
- Happy Forgings generated Rs 1,277 crore of operating cash flow in FY21-FY26 against Rs 1,393 crore of capex.
- Happy Forgings increased forging capacity 2.2x to 148,000 MT and machining capacity 2.3x to 68,000 MT by FY26.
- Happy Forgings reported Rs 421 crore of cash, bank balances and current liquid assets at March 31, 2026.
- Happy Forgings’ FY26 net debt to EBITDA was negative 0.19x, compared with 0.79x in FY21.
powered by IRIS
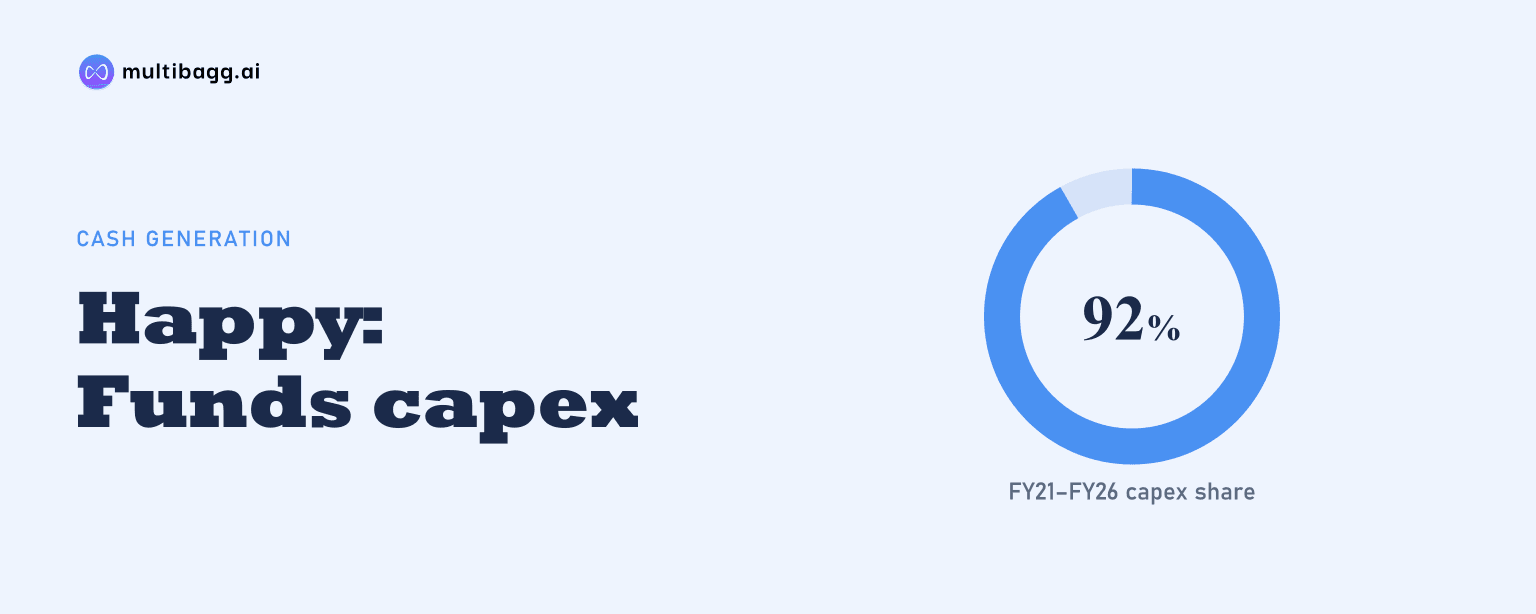
Happy Forgings Limited funded about 92% of its Rs 1,393 crore FY21-FY26 capital expenditure with Rs 1,277 crore of operating cash flow, while forging capacity rose 2.2x to 148,000 metric tonnes (MT). Machining capacity reached 68,000 MT, and FY26 net debt to EBITDA was negative 0.19x.
Know Happy Forgings inside out
Results, valuation, peers and who's buying, in one view.
How did Happy Forgings fund its FY21-FY26 capex?
Happy Forgings funded most of its FY21-FY26 capital expenditure through internally generated operating cash flow. Cumulative operating cash flow was Rs 1,277 crore against Rs 1,393 crore of capex, a funding coverage of about 92% based on those disclosed totals. The remaining difference was Rs 116 crore over the six-year period. EBITDA, or earnings before interest, tax, depreciation and amortisation, totalled Rs 1,995 crore, and operating cash flow represented 64% of that cumulative EBITDA.
Cash conversion increased markedly by FY26. Operating cash flow rose from Rs 50 crore in FY21 to Rs 445 crore in FY26, while the ratio of operating cash flow to EBITDA moved from 31% to 94%. Capex also accelerated from Rs 92 crore to Rs 461 crore over the same comparison. Happy Forgings attributes cash accruals to high margins and working-capital efficiency; its EBITDA margin rose from 27.1% in FY21 to 30.4% in FY26.
What manufacturing capacity did Happy Forgings add?
Happy Forgings increased forging capacity by 81,000 MT and machining capacity by 38,500 MT between FY21 and FY26. Forging capacity rose from 67,000 MT to 148,000 MT, or 2.2x, while machining capacity rose from 29,500 MT to 68,000 MT, or 2.3x. The company’s gross block, capital work-in-progress and intangibles together increased from Rs 547 crore in FY21 to Rs 1,725 crore in FY26, a stated 3.2x increase.
The asset build-out accompanied a rise in output, though capacity expanded faster than finished-goods volume. Finished-goods volume increased from 35,534 MT in FY21 to 63,105 MT in FY26, while revenue per kilogram increased from Rs 165 to Rs 245. EBITDA per kilogram rose from Rs 45 to Rs 75. This comparison indicates that the company added both manufacturing scale and higher-value production economics during the six-year period.
How did Happy Forgings’ balance sheet change during the build-out?
Happy Forgings ended FY26 with Rs 2,128 crore of net worth, Rs 330 crore of borrowings and a debt-to-equity ratio of 0.15x. Net worth increased from Rs 645 crore in FY21, whereas borrowings increased from Rs 153 crore. Despite the higher absolute borrowings, debt to equity was below the FY21 ratio of 0.24x and below the six-year peak of 0.31x in FY22, reflecting the faster expansion in equity.
Liquidity and the company’s net-debt measure also changed over the period. Cash, bank balances and current liquid assets stood at Rs 421 crore at March 31, 2026, compared with Rs 28 crore at March 31, 2021. Management described current liquidity surplus as about Rs 350 crore and said it exceeded the primary capital raised in the initial public offering. Net debt to EBITDA moved from 0.79x in FY21 to negative 0.19x in FY26; the company calculates net debt after including short-term liquid mutual funds and fixed deposits along with cash and bank balances.
Got a follow-up? Ask IRIS
What happened to Happy Forgings’ returns and asset turnover?
Happy Forgings’ return on equity was 15.2% and return on capital employed was 18.2% in FY26, both below their FY23 levels. Return on equity reached 23.5% in FY23 before declining to 18.7% in FY24 and 15.2% in both FY25 and FY26. Return on capital employed reached 26.2% in FY23, then was 22.7% in FY24, 18.8% in FY25 and 18.2% in FY26. The FY25 return figures exclude Rs 4.8 crore of post-tax insurance income.
Gross fixed-assets turnover declined as the asset base was expanded. The ratio rose from 1.2 in FY21 to 1.4 in FY23, then fell to 1.0 in FY26. Over the same FY21-FY26 span, net block plus capital work-in-progress and intangibles rose from Rs 455 crore to Rs 1,346 crore. Sales nevertheless increased from Rs 585 crore to Rs 1,546 crore, showing that revenue grew alongside the investment programme but at a slower rate than the disclosed gross asset build-out.
What does capacity utilisation show about Happy Forgings’ ramp-up?
Happy Forgings used 59% of forging capacity and 82% of machining capacity in FY26. Forging utilisation was 60% in FY21, rose to 67% in FY22, and then ranged from 57% to 63% through FY26 as capacity expanded from 81,000 MT in FY22 to 148,000 MT in FY26. Machining utilisation increased from 71% in FY21 to a high of 87% in FY24 before moderating to 83% in FY25 and 82% in FY26.
The different utilisation rates matter because the two production stages have expanded at different operating intensity. Machining capacity was used at 82% in FY26, 23 percentage points above forging’s 59%, while its installed base was 68,000 MT against forging’s 148,000 MT. The presentation notes that installed capacity is measured on the last day of each period, whereas utilisation is calculated on average available capacity during that period. That measurement distinction limits direct conversion of the percentages into unused annual tonnage.
Conclusion
Happy Forgings paired Rs 1,277 crore of FY21-FY26 operating cash flow with Rs 1,393 crore of capex to expand forging capacity to 148,000 MT and machining capacity to 68,000 MT. The balance-sheet data show Rs 421 crore of cash, bank balances and current liquid assets at March 31, 2026, alongside a negative 0.19x net-debt-to-EBITDA ratio, while asset turnover and returns were below their FY23 levels after the investment cycle.
The next factors to watch are the utilisation ramp across the enlarged 148,000 MT forging base and 68,000 MT machining base, particularly after FY26 rates of 59% and 82%, respectively. Management also states that it intends to maintain judicious capital allocation while retaining flexibility for organic and inorganic growth opportunities; the presentation does not specify a further capex amount or timetable.