










Happy Forgings Limited lifted EBITDA per kg to 75 rupees
Key highlights
- Happy Forgings increased EBITDA per kg from 45 rupees in FY21 to 75 rupees in FY26.
- Finished-goods volume rose 1.8 times to 63,105 metric tonnes in FY26 from 35,534 metric tonnes in FY21.
- Happy Forgings reported FY26 sales of Rs 1,546 crore, EBITDA of Rs 471 crore and PAT of Rs 302 crore.
- EBITDA margin increased by 330 basis points to 30.4% in FY26 from 27.1% in FY21.
powered by IRIS
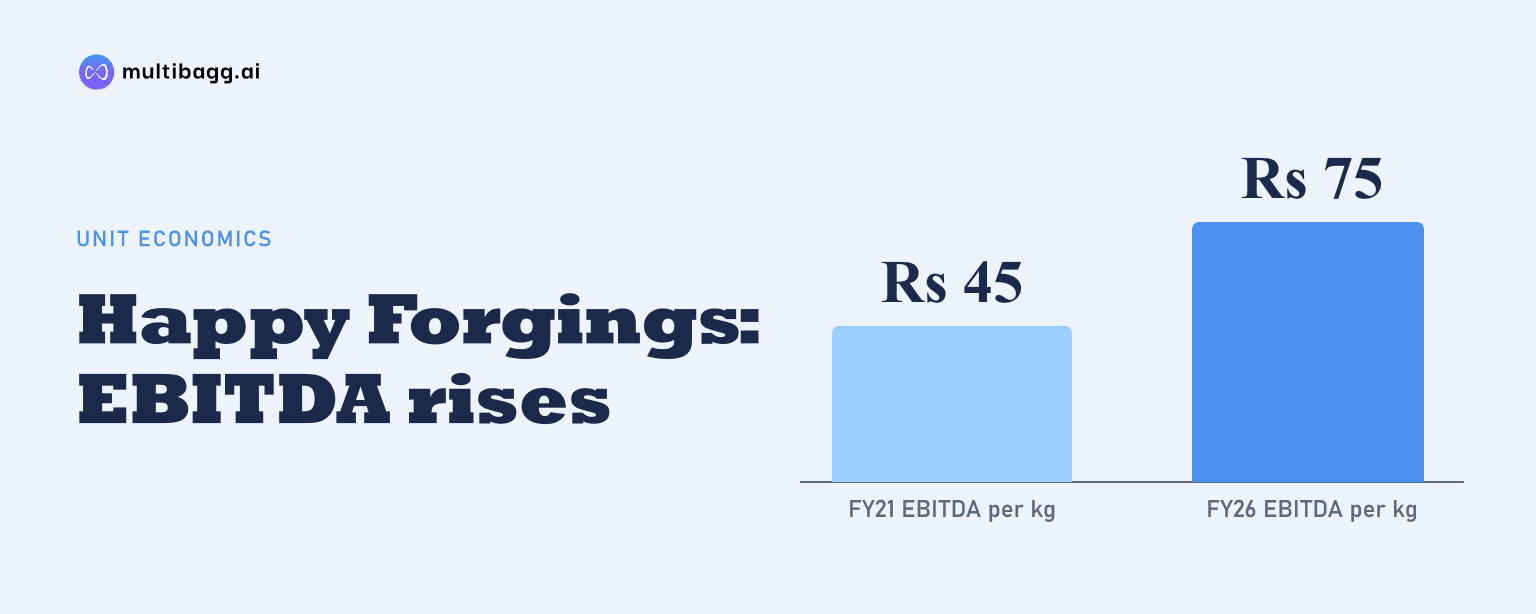
Happy Forgings Limited lifted earnings before interest, tax, depreciation and amortisation (EBITDA) per kg to 75 rupees in financial year (FY) 2026 from 45 rupees in FY21, while finished-goods volume reached 63,105 metric tonnes, 1.8 times the FY21 level. The presentation links the change to value addition, engineering capabilities, product mix and operating efficiency.
Know Happy Forgings inside out
Results, valuation, peers and who's buying, in one view.
How did Happy Forgings increase EBITDA per kg over five years?
Happy Forgings increased EBITDA per kg by 30 rupees, from 45 rupees in FY21 to 75 rupees in FY26, as realisation per kg rose from 165 rupees to 245 rupees. The company presents the FY21-to-FY26 realisation change as a 1.5-times increase and the EBITDA-per-kg progression as part of its value-addition strategy.
The annual movement shows that EBITDA per kg increased every year, reaching 54 rupees in FY22, 63 rupees in FY23, 68 rupees in FY24 and 71 rupees in FY25 before reaching 75 rupees in FY26. Realisation per kg rose to 248 rupees in FY25 but declined by 3 rupees in FY26, when the company said realisations were broadly stable and range-bound despite softening raw-material prices.
The realisation data contains two stated qualifications. FY23 realisation excludes prior-period income, while FY24 realisation was adjusted for higher recovery of air-freight costs on one order. Happy Forgings nevertheless reports the same FY21-to-FY26 1.5-times realisation increase alongside its 1.8-times finished-goods volume growth.
Did finished-goods volumes grow alongside unit profitability?
Yes. Happy Forgings' finished-goods volume increased by 27,571 metric tonnes, from 35,534 metric tonnes in FY21 to 63,105 metric tonnes in FY26, while EBITDA per kg rose by 30 rupees. FY26 volume was also 6,199 metric tonnes higher than the 56,906 metric tonnes recorded in FY25.
The output increase accompanied a larger manufacturing base. Forging capacity rose from 67,000 metric tonnes in FY21 to 148,000 metric tonnes in FY26, or 2.2 times, while machining capacity increased from 29,500 metric tonnes to 68,000 metric tonnes, or 2.3 times. In FY26, forging utilisation was 59%, compared with 60% in FY21, and machining utilisation rose to 82% from 71%.
Finished-goods volume grew less quickly than both installed-capacity measures, at 1.8 times versus 2.2 times for forging and 2.3 times for machining. The presentation says capacity represents annual installed capacity at the last date of each period, whereas utilisation is calculated on average available capacity during the period, making the measures different operational indicators.
How did Happy Forgings' sales and profits change by FY26?
Happy Forgings increased sales to Rs 1,546 crore in FY26 from Rs 585 crore in FY21, while EBITDA rose to Rs 471 crore from Rs 159 crore and profit after tax (PAT) increased to Rs 302 crore from Rs 86 crore. The presentation reports FY21-to-FY26 compound annual growth rates (CAGR) of 21% for sales, 24% for EBITDA and 28% for PAT.
Profit measures outpaced sales over the five financial years. Sales increased 2.6 times, gross profit increased 2.7 times to Rs 915 crore, EBITDA increased 3.0 times and PAT increased 3.5 times. In FY26 alone, sales rose by Rs 137 crore from FY25, EBITDA increased by Rs 64 crore and PAT rose by Rs 35 crore.
Got a follow-up? Ask IRIS
What does Happy Forgings' margin progression show?
Happy Forgings reported EBITDA margin of 30.4% in FY26, up 330 basis points from 27.1% in FY21, while PAT margin rose 473 basis points to 19.5%. A basis point is one-hundredth of a percentage point. Gross margin also increased by 215 basis points over the period, reaching 59.1% in FY26 from 57.0% in FY21.
The expansion was not identical across all years. EBITDA margin fell to 26.8% in FY22, then reached 28.5% in FY23 and FY24, 28.9% in FY25 and 30.4% in FY26. Gross margin fell to 53.9% in FY23 before recovering, whereas PAT margin increased each year from 14.8% in FY21 to 19.5% in FY26.
Management describes improving product mix and execution as drivers of sustained profitability expansion. Its disclosed growth framework includes in-house product development for industrial opportunities, lightweight forging and machining for passenger vehicles, more business with existing original equipment manufacturers, new customers, export growth and lower operating costs.
How was Happy Forgings' capacity expansion funded?
Happy Forgings generated cumulative operating cash flow of Rs 1,277 crore between FY21 and FY26 and spent Rs 1,393 crore on capital expenditure over the same period. Cumulative operating cash flow equalled 64% of cumulative EBITDA of Rs 1,995 crore, and the presentation says cash accruals largely funded the capacity build-up.
Annual operating cash flow increased to Rs 445 crore in FY26 from Rs 50 crore in FY21, while operating-cash-flow conversion relative to EBITDA rose to 94% from 31%. Capital expenditure was Rs 461 crore in FY26 versus Rs 92 crore in FY21, and gross block, capital work in progress and intangibles reached Rs 1,725 crore, 3.2 times the FY21 level.
At March 31, 2026, Happy Forgings reported borrowings of Rs 330 crore, net worth of Rs 2,128 crore and debt-to-equity of 0.15 times. Cash, bank balances and current liquid assets stood at Rs 421 crore, while net debt to EBITDA was negative 0.19 times after the FY26 capacity additions.
Conclusion
Happy Forgings combined higher output with improved unit economics between FY21 and FY26. Finished-goods volume increased 1.8 times, EBITDA per kg rose from 45 rupees to 75 rupees, and EBITDA margin increased 330 basis points to 30.4%. Over the same period, sales grew 2.6 times, EBITDA 3.0 times and PAT 3.5 times.
What to watch next is management's execution of its disclosed capacity and growth plan. Forging capacity was 148,000 metric tonnes at 59% utilisation in FY26, while machining capacity was 68,000 metric tonnes at 82% utilisation; management has also earmarked about Rs 650 crore for heavy-forging capacity and identified passenger vehicles, industrial markets, exports, customer additions and acquisitions or alliances as growth avenues.