










IndiQube has 3.81 million sq ft headroom at 91% occupancy
Key highlights
- IndiQube reported 3.81 million sq ft of Q2 FY27 growth headroom, equivalent to 85,000 seats.
- IndiQube's rent-yielding area grew 22% year on year to 7.05 million sq ft in Q2 FY27.
- IndiQube's steady-state occupancy reached 91% in Q2 FY27, up from 89% in Q2 FY26.
- IndiQube had 2.67 million sq ft of LOI-signed future supply, or 59,000 seats, to become operational in 12 to 18 months.
powered by IRIS
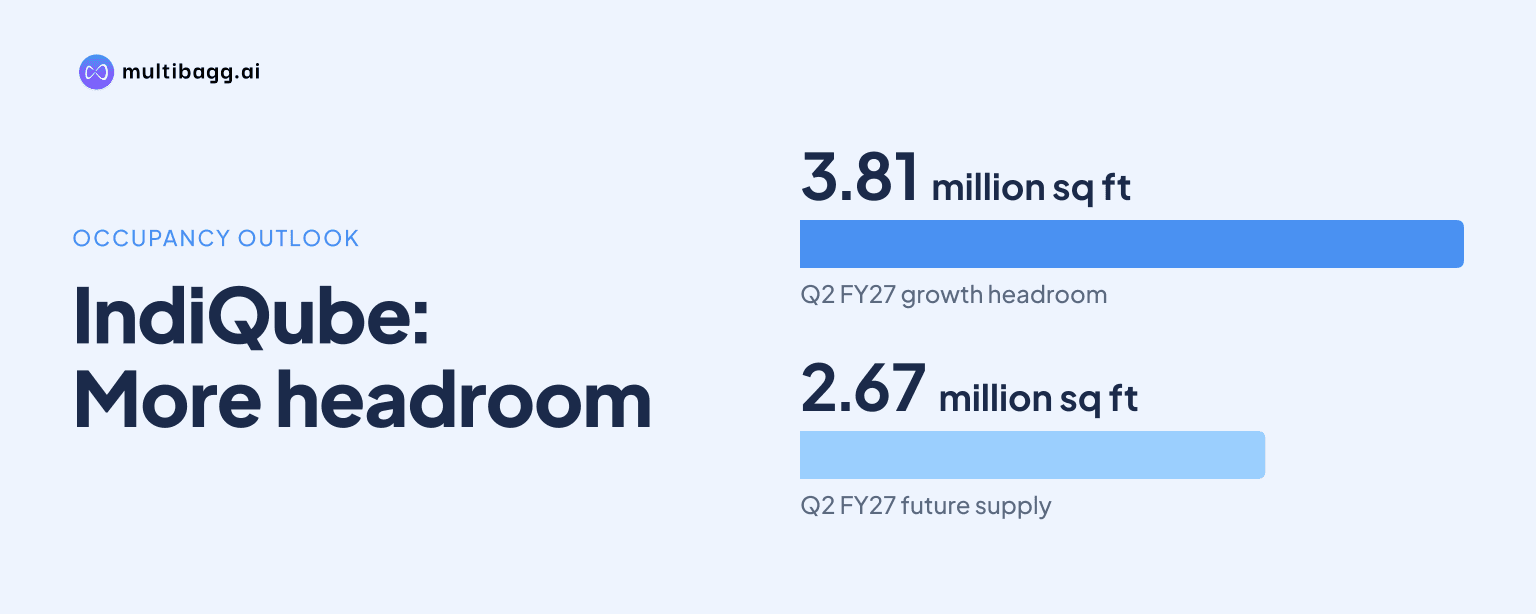
IndiQube Spaces Limited had 3.81 million sq ft of growth headroom across 85,000 seats in Q2 FY27, while steady-state occupancy at centres older than 12 months reached 91%, up from 89% in Q2 FY26. The headroom combines unoccupied operational space and supply signed under letters of intent.
Know Indiqube Spaces inside out
Results, valuation, peers and who's buying, in one view.
How much capacity does IndiQube have to fill?
IndiQube has 3.81 million sq ft of growth headroom across 85,000 seats in Q2 FY27. Its 10.86 million sq ft area under management comprised 7.05 million sq ft of rent-yielding area and 3.81 million sq ft not yet generating rent. IndiQube defines area under management as rent-paying area plus Letter of Intent, or LOI, signed area.
The 3.81 million sq ft headroom consists of 1.14 million sq ft of operational but unoccupied space and 2.67 million sq ft of LOI-signed future supply. The operational component is the difference between 8.19 million sq ft of rent-paying area and 7.05 million sq ft of rent-yielding area. The LOI pipeline represents 59,000 future seats and is expected to become operational in the next 12 to 18 months.
IndiQube pays landlords for the 8.19 million sq ft rent-paying area, but collects client rentals only on its 7.05 million sq ft rent-yielding area. This distinction separates capacity already in operation from future supply that remains subject to operational launch. The 85,000-seat headroom includes both vacant operational seats and the 59,000 future-supply seats.
How did IndiQube's managed and occupied space change?
IndiQube expanded its managed, operational and rent-yielding areas in Q2 FY27 compared with Q2 FY26. Area under management increased 19% to 10.86 million sq ft, while rent-paying area and rent-yielding area each increased 22%, reaching 8.19 million sq ft and 7.05 million sq ft, respectively.
From Q1 FY27 to Q2 FY27, area under management increased by 0.25 million sq ft, rent-paying area by 0.35 million sq ft and rent-yielding area by 0.31 million sq ft. Over the year, rent-yielding area added 1.25 million sq ft, compared with a 1.49 million sq ft increase in rent-paying area. This left 1.14 million sq ft of operational area not yet rent-yielding in Q2 FY27.
IndiQube had 182,000 operational seats within its 8.19 million sq ft rent-paying area and 241,000 total seats across the full 10.86 million sq ft portfolio. The difference of 59,000 seats matches LOI-signed future supply. The company also reported 138 centres in 17 cities, compared with 125 centres in Q2 FY26, while total seats rose 19% from more than 203,000.
Got a follow-up? Ask IRIS
Why is IndiQube's steady-state occupancy higher than overall occupancy?
IndiQube's steady-state occupancy was 91% in Q2 FY27 because it covers mature centres more than 12 months old, while overall occupancy was 86% across its operational portfolio. IndiQube defines occupancy as rent-yielding area divided by rent-paying area. The two measures therefore cover different sets of centres.
Steady-state occupancy rose from 89% in Q2 FY26 to 90% in Q1 FY27 and 91% in Q2 FY27. This two-percentage-point year-on-year increase coincided with rent-paying area rising from 6.70 million sq ft to 8.19 million sq ft. The presentation reports the occupancy measure for mature centres separately from the portfolio-wide figure.
Overall occupancy moved in the opposite direction, declining to 86% in Q2 FY27 from 87% in Q2 FY26. During the same period, operational rent-paying area grew 22% and added 1.49 million sq ft. IndiQube does not provide occupancy figures by city, centre or client segment, so the presentation does not identify the locations behind the difference between overall and steady-state occupancy.
What supports IndiQube's conversion of capacity into rent-yielding area?
IndiQube states that an average centre reaches operational breakeven at 55% to 60% occupancy after six months and reaches steady state at 85% to 90% occupancy after 12 months. Its Q2 FY27 steady-state occupancy of 91% exceeded that disclosed steady-state range. The company presents these figures as portfolio-level operating benchmarks.
The occupied base included 884 clients across India in H1 FY27. Global Capability Centres, or GCCs, contributed 54% of revenue and accounted for 49% of occupied area. Clients with 300 or more seats represented 65% of occupied seats and had an average lease duration of 47 months, compared with 42 months for the portfolio.
IndiQube reported an average client lock-in of 35 months, fit-out and renovation payback of 36 months, and landlord lock-in of 38 months. Average fit-out cost was Rs 1,650 per sq ft, while the revenue-to-rent ratio was 2.27. Management says these timelines align client obligations, landlord terms and recovery of interior and renovation expenditure in an approximately three-year cycle.
The company also disclosed demand-related activity in Q2 FY27, including new office-supply sign-ups for about 5,000 seats in Chennai and about 3,000 seats in Hyderabad. IndiQube signed about 2,000 design-and-build seats across several metros and a roughly 700-seat multi-city workspace deal with a global staffing solutions company. The presentation does not state how much of this activity had entered rent-yielding area by Q2 FY27.
Conclusion
IndiQube's Q2 FY27 portfolio had 7.05 million sq ft of rent-yielding area within 10.86 million sq ft under management, leaving 3.81 million sq ft of headroom. The rise in steady-state occupancy to 91% from 89% shows higher utilisation in mature centres, while overall occupancy of 86% reflects the wider operational portfolio.
The next disclosed development is the operationalisation of 2.67 million sq ft of LOI-signed supply over the next 12 to 18 months. The key reported measures to watch are whether rent-yielding area continues to grow from 7.05 million sq ft, how the 1.14 million sq ft operational vacancy changes, and whether overall occupancy converges with the mature-centre measure as locations pass 12 months.