










Trident Q2 profit rose 93% as revenue fell and margins widened
Key highlights
- Trident’s Q2FY27 consolidated net profit rose 93.09% year on year to Rs 1,756 crore.
- Trident’s Q2FY27 consolidated total income declined 3.67% year on year to Rs 17,371 crore.
- Trident’s standalone textile EBIT margin rose 896 basis points year on year to 18.32% in Q2FY27.
- Trident’s standalone net debt declined to Rs 7,215 crore at September 2026 from Rs 9,873 crore at March 2026.
powered by IRIS
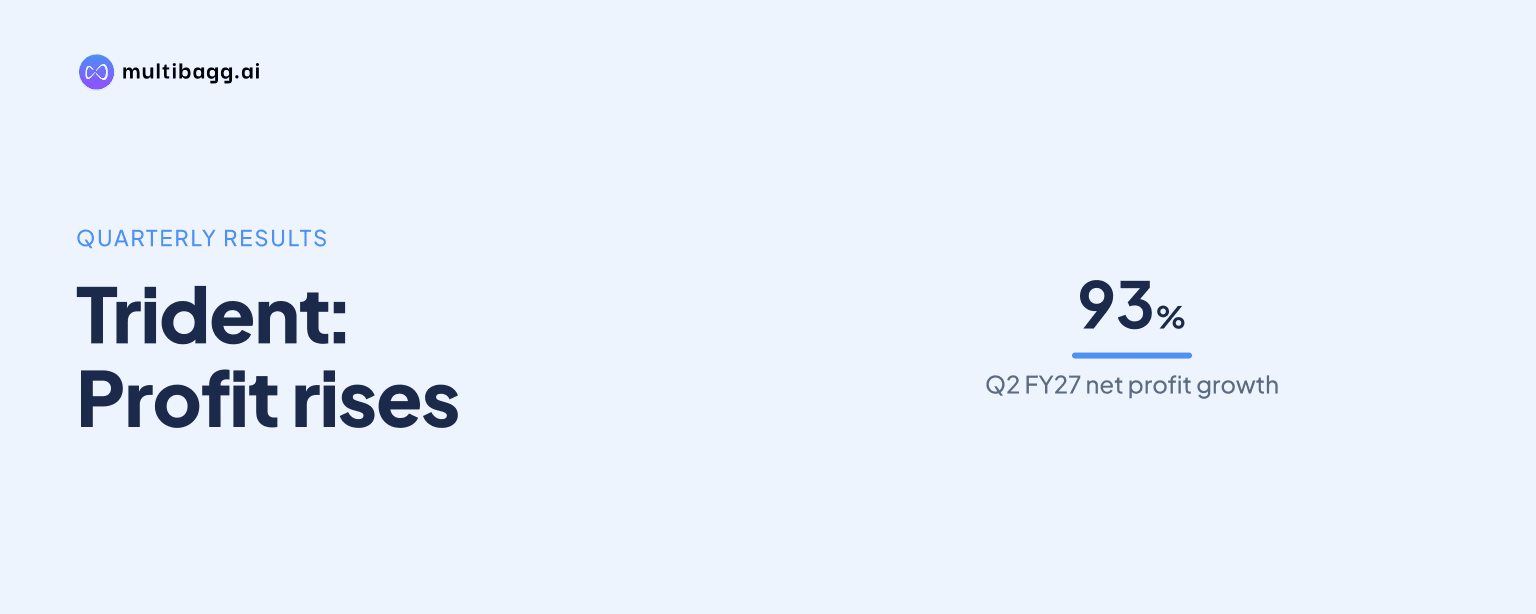
Trident Group reported Q2FY27 consolidated net profit of Rs 1,756 crore, up 93.09% year on year, although total income declined 3.67% to Rs 17,371 crore. The result reflected a 653-basis-point expansion in consolidated EBITDA margin to 19.37% and an 896-basis-point rise in standalone textile EBIT margin to 18.32%.
Know Trident inside out
Results, valuation, peers and who's buying, in one view.
How did Trident’s consolidated Q2FY27 earnings change?
Trident’s consolidated net profit rose 93.09% year on year and 11.06% sequentially to Rs 1,756 crore in Q2FY27. Total income was Rs 17,371 crore, down 3.67% from Rs 18,032 crore in both Q1FY27 and Q2FY26, while EBITDA rose 45.25% year on year to Rs 3,365 crore.
The margin movement lifted profit before tax, or PBT, by 87.55% year on year to Rs 2,325 crore. EBITDA margin increased to 19.37% from 12.85% in Q2FY26 and 17.55% in Q1FY27, while PBT margin reached 13.38%, compared with 6.87% and 11.99%, respectively. Finance cost rose 30.85% year on year to Rs 325 crore, while depreciation fell 13.71% to Rs 715 crore.
Cash profit increased 42.17% year on year to Rs 2,471 crore, and earnings per share rose to Rs 0.34 from Rs 0.18. The presentation therefore shows earnings increasing despite lower income, with the 6.53-percentage-point year-on-year rise in EBITDA margin providing the principal consolidated comparison.
What drove Trident’s textile-margin expansion?
Trident’s standalone textile segment increased EBIT by 81.72% year on year to Rs 2,619 crore despite a 7.10% decline in revenue to Rs 14,291 crore. Textile EBIT margin rose to 18.32% from 9.37% in Q2FY26, an increase of 896 basis points, and from 15.00% in Q1FY27, an increase of 332 basis points.
Textiles accounted for 83% of Q2FY27 standalone revenue, compared with 17% for paper and chemicals. Management’s disclosed margin-improvement initiatives include developing differentiated products to earn a premium, serving luxury, fashion-accent and sports segments, and company-wide cost optimisation to reduce conversion cost. The presentation does not quantify the contribution of each initiative to the textile margin change.
Standalone EBITDA rose 42.34% year on year to Rs 3,298 crore, while its margin increased to 19.01% from 12.85%. Standalone EBIT margin rose to 14.96% from 8.31%, and profit after tax margin reached 9.84% from 5.12%, alongside net profit of Rs 1,706 crore.
What happened in Trident’s paper and chemicals business?
Trident’s standalone paper and chemicals revenue rose 16.61% year on year to Rs 2,879 crore in Q2FY27, but EBIT fell 20.40% to Rs 343 crore. EBIT margin declined to 11.90% from 17.44% in Q2FY26, a reduction of 553 basis points.
The sequential trend was also lower. Revenue fell 3.19% from Rs 2,974 crore in Q1FY27, while EBIT declined 34.58% from Rs 524 crore. Consequently, paper and chemicals EBIT margin fell 571 basis points from 17.62%, contrasting with the textile segment’s 332-basis-point sequential margin expansion.
The segment figures indicate that the company-level improvement was concentrated in textiles, the segment with 83% of standalone revenue. Paper and chemicals represented 17% of revenue in Q2FY27 and reported an 11.90% EBIT margin, below both the preceding quarter and the year-earlier quarter.
Got a follow-up? Ask IRIS
How did Trident’s revenue mix and export exposure change?
Trident’s consolidated revenue mix moved modestly away from bed and bath linen in Q2FY27. Bed and bath linen represented 51% of revenue, compared with 55% in Q2FY26, while yarn increased to 32% from 31% and paper rose to 17% from 14%. In Q1FY27, the respective shares were 52%, 31% and 17%.
Standalone exports represented 53% of income in Q2FY27, unchanged from Q1FY27 and one percentage point above Q2FY26’s 52%. Standalone total income was Rs 17,347 crore, down from Rs 17,971 crore in Q1FY27 and Rs 18,035 crore in Q2FY26, even as the export share held at 53% across both FY27 quarters.
For H1FY27, Trident reported standalone total income of Rs 35,319 crore, EBITDA of Rs 6,378 crore and profit after tax of Rs 3,236 crore. EBITDA margin was 18.06%, PBT margin was 12.36%, and earnings per share were Rs 0.63; these six-month figures are not a full-year projection.
How did Trident’s balance sheet change by September 2026?
Trident’s standalone net debt declined to Rs 7,215 crore as of September 2026, from Rs 9,873 crore in March 2026 and Rs 8,465 crore in September 2025. Gross debt was Rs 13,675 crore, down from Rs 17,678 crore in March 2026, while cash and cash equivalents were Rs 6,460 crore, compared with Rs 7,805 crore six months earlier.
Net worth increased to Rs 48,471 crore at September 2026 from Rs 47,571 crore at March 2026. Net debt to equity was 0.15 times, versus 0.22 times in June 2026, and annualised net debt to EBITDA was 0.57 times, versus 0.83 times. Long-term loans declined to Rs 8,944 crore from Rs 9,642 crore at March 2026.
The balance-sheet measures improved while consolidated finance cost rose 30.85% year on year to Rs 325 crore in Q2FY27. The presentation provides debt balances and leverage ratios, but does not state the cause of the quarterly finance-cost increase or disclose a borrowing target.
Conclusion
Trident’s Q2FY27 performance was driven by profitability rather than income growth. Consolidated income declined 3.67%, but net profit rose 93.09% as consolidated EBITDA margin reached 19.37% and textile EBIT margin increased to 18.32%. The textile gain outweighed lower profitability in paper and chemicals, where EBIT margin fell to 11.90%.
The next reported periods will indicate whether Trident can maintain textile margins while segment revenue was down 7.10% year on year, and whether paper and chemicals can reverse its 571-basis-point sequential margin decline. Management’s disclosed plan centres on differentiated products, premium-oriented categories and conversion-cost optimisation, while standalone net debt stood at Rs 7,215 crore in September 2026.