










Trident reduces net debt to Rs 721.5 crore in September 2026
Key highlights
- Trident's standalone net debt was Rs 721.5 crore at September 2026, down from Rs 987.3 crore at March 2026.
- Trident's annualised net-debt-to-EBITDA ratio declined to 0.57 times in H1 FY27 from 1.05 times in FY26.
- Trident's H1 FY27 standalone EBITDA increased to Rs 637.8 crore from Rs 541.2 crore in H1 FY26.
- Trident's Q2 FY27 Textile EBIT rose 81.72% year on year to Rs 261.9 crore.
powered by IRIS
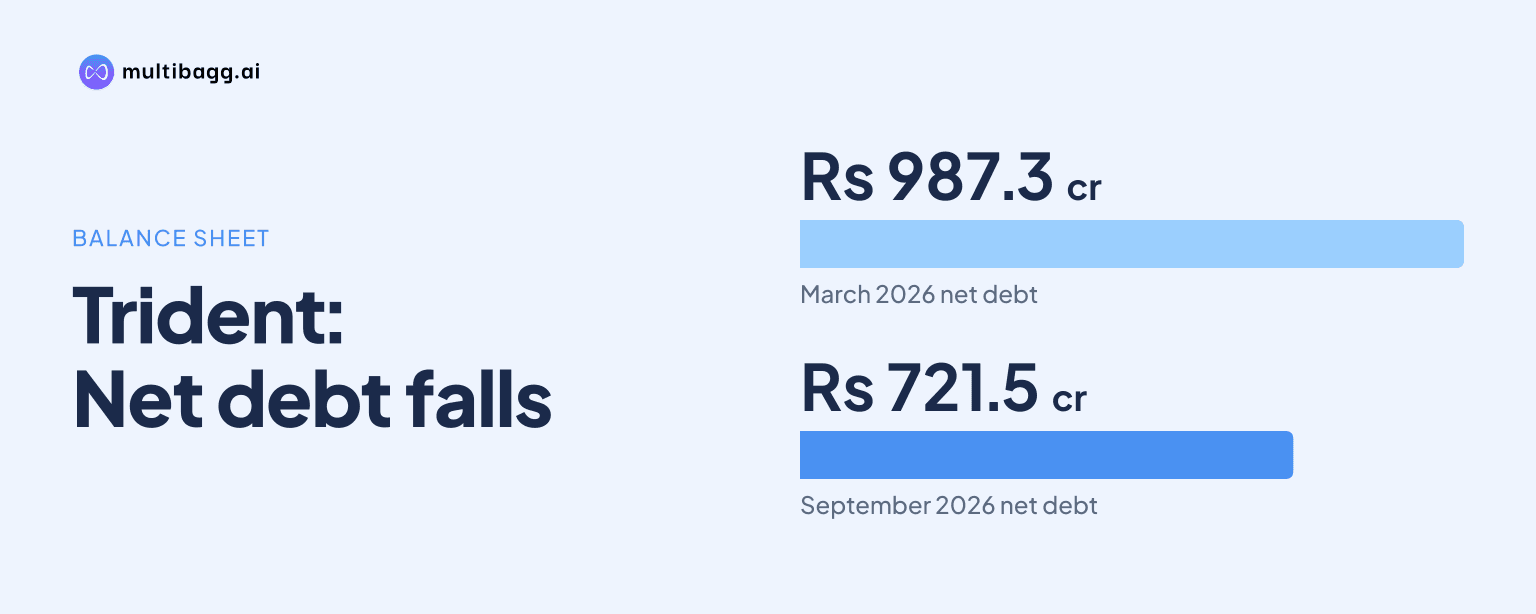
Trident Limited reduced standalone net debt to Rs 721.5 crore at September 2026 from Rs 987.3 crore at March 2026, while annualised net-debt-to-EBITDA declined to 0.57 times from 0.83 times at June 2026. The lower debt position coincided with H1 FY27 standalone profit after tax of Rs 323.6 crore, against Rs 231.8 crore in H1 FY26.
Know Trident inside out
Results, valuation, peers and who's buying, in one view.
How much did Trident reduce net debt?
Trident reduced net debt by Rs 265.8 crore, or 26.9%, between March 2026 and September 2026. Net debt stood at Rs 721.5 crore in September 2026, below Rs 987.3 crore at March 2026 and Rs 846.5 crore at September 2025, based on the standalone balance-sheet figures.
The improvement also changed the leverage measures reported by Trident. Its annualised net-debt-to-EBITDA, or earnings before interest, tax, depreciation and amortisation, ratio fell to 0.57 times at September 2026 from 0.83 times at June 2026 and 0.78 times at September 2025. The H1 FY27 ratio was also below 1.05 times reported for FY26.
What changed in Trident's borrowings and cash?
Trident's gross debt fell by Rs 400.3 crore from March 2026 to September 2026, exceeding the Rs 134.5 crore decline in cash and cash equivalents over the same period. Gross debt was Rs 1,367.5 crore and cash was Rs 646.0 crore at September 2026, resulting in net debt of Rs 721.5 crore.
Both loan categories were lower at September 2026. Short-term loans declined by Rs 330.5 crore to Rs 473.1 crore from Rs 803.6 crore at March 2026, while long-term loans decreased by Rs 69.8 crore to Rs 894.4 crore from Rs 964.2 crore. The presentation does not disclose the use of proceeds or specific repayment sources behind these movements.
Trident's net-debt-to-equity ratio was 0.15 times at September 2026, compared with 0.22 times at June 2026 and 0.18 times at September 2025. Net worth rose by Rs 90.0 crore from March 2026 to Rs 4,847.1 crore, while total assets declined by Rs 200.2 crore to Rs 7,299.7 crore at September 2026.
How did H1 FY27 earnings accompany Trident's deleveraging?
Trident reported standalone EBITDA of Rs 637.8 crore in H1 FY27, up from Rs 541.2 crore in H1 FY26, and EBITDA margin increased to 18% from 15%. This Rs 96.6 crore increase in half-year EBITDA accompanied the lower annualised net-debt-to-EBITDA ratio of 0.57 times at the end of H1 FY27.
Profit before tax increased to Rs 436.4 crore in H1 FY27 from Rs 311.9 crore in H1 FY26, while profit after tax rose to Rs 323.6 crore from Rs 231.8 crore. Trident reported profit-before-tax margin of 12% and profit-after-tax margin of 9% for H1 FY27, compared with 9% and 7%, respectively, in H1 FY26.
Interest coverage was annualised at 8.02 times in H1 FY27, up from 5.58 times in FY26, according to Trident's ratio summary. Finance cost was Rs 62.2 crore and EBIT, or earnings before interest and tax, was Rs 498.6 crore in H1 FY27; the company specifies that H1 FY27 ratios are annualised.
Got a follow-up? Ask IRIS
Which segments shaped Trident's Q2 FY27 profitability?
Trident's Textile segment delivered the larger Q2 FY27 EBIT movement, with EBIT rising 17.60% sequentially to Rs 261.9 crore and 81.72% year on year. Textile revenue declined 3.72% sequentially to Rs 1,429.1 crore and 7.10% year on year, but its EBIT margin rose to 18.32% from 15.00% in Q1 FY27 and 9.37% in Q2 FY26.
Textile accounted for 83% of Q2 FY27 standalone revenue, compared with 17% for Paper & Chemical. Paper & Chemical revenue increased 16.61% year on year to Rs 287.9 crore, but EBIT declined 20.40% to Rs 34.3 crore and its EBIT margin fell to 11.90% from 17.44% in Q2 FY26.
At the consolidated level, Trident reported Q2 FY27 EBITDA of Rs 336.5 crore, up 6.36% from Q1 FY27 and 45.25% from Q2 FY26. Consolidated net profit was Rs 175.6 crore, rising 11.06% sequentially and 93.09% year on year, while total income of Rs 1,737.1 crore was 3.67% lower on both comparisons shown in the presentation.
What do Trident's other H1 FY27 ratios show?
Trident reported a current ratio of 1.69 times in H1 FY27, compared with 1.56 times in FY26, while inventory days fell to 56 from 65. Debtor days increased to 14 in H1 FY27 from 13 in FY26, and fixed-asset turnover rose to 1.60 times from 1.55 times.
Return on equity was annualised at 13.4% in H1 FY27, compared with 7.9% in FY26, and return on capital employed was annualised at 16.9%, compared with 10.7%. These are annualised half-year ratios, rather than reported full-year outcomes, as stated in Trident's presentation.
Revenue mix shifted modestly in H1 FY27. Bed and bath linen represented 52% of revenue, down from 55% in H1 FY26, while yarn rose to 31% from 30% and paper increased to 17% from 15%; exports remained 53% of income in both half-year periods.
Conclusion
Trident's September 2026 standalone results show a Rs 265.8 crore reduction in net debt from March 2026, driven by a Rs 400.3 crore reduction in gross debt that more than offset lower cash balances. H1 FY27 earnings also improved, with EBITDA up to Rs 637.8 crore and annualised interest coverage increasing to 8.02 times.
Next, investors can watch whether Trident's stated margin initiatives, including differentiated products for luxury, fashion accents and sports segments and conversion-cost optimisation, appear in subsequent results. The next reported trend will also show whether Textile's Q2 FY27 margin expansion can continue while Paper & Chemical EBIT, which fell to Rs 34.3 crore, recovers.