










IndiQube H1 FY27 PAT rises 66% as EBIT margin reaches 14%
Key highlights
- IndiQube reported H1 FY27 IGAAP-equivalent PAT of Rs 92 crore, up 66% from Rs 55 crore.
- H1 FY27 revenue from operations rose 35% to Rs 904 crore and EBIT margin increased to 14% from 12%.
- Adjusted cash EBIT rose 56% to Rs 178 crore in H1 FY27, lifting its margin to 20% from 17%.
- IndiQube had 10.86 million square feet under management and 241,000 seats at Q2 FY27.
powered by IRIS
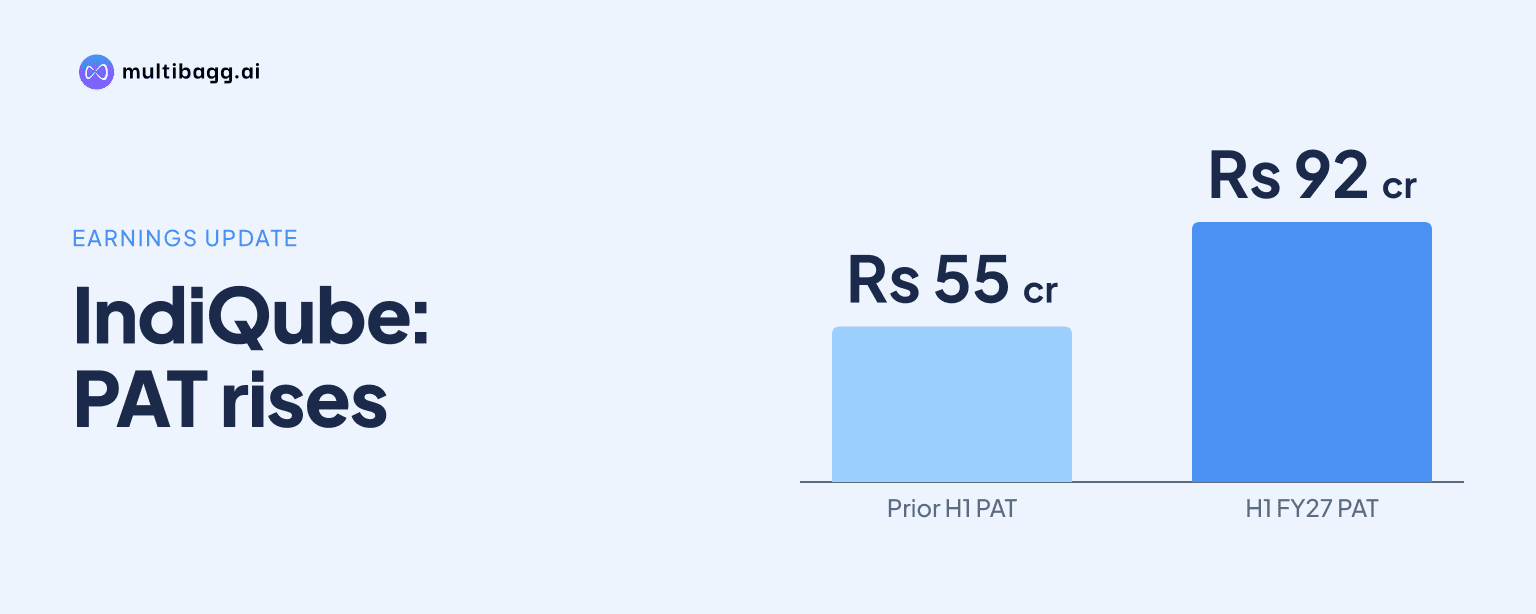
IndiQube Spaces Limited reported IGAAP-equivalent profit after tax of Rs 92 crore in H1 FY27, up 66% from Rs 55 crore in H1 FY26, as its EBIT margin increased to 14% from 12%. Revenue from operations rose 35% to Rs 904 crore and adjusted cash EBIT increased 56% to Rs 178 crore.
Know Indiqube Spaces inside out
Results, valuation, peers and who's buying, in one view.
How did IndiQube perform in H1 FY27?
IndiQube delivered Rs 904 crore of IGAAP-equivalent revenue from operations in H1 FY27, compared with Rs 668 crore in H1 FY26, an increase of 35%. Earnings before interest, tax, depreciation and amortisation (EBITDA) increased 37% to Rs 191 crore from Rs 139 crore, while the EBITDA margin remained 21% in both half-years.
The faster increase came below EBITDA. Earnings before interest and tax (EBIT) rose 48% to Rs 122 crore from Rs 82 crore, lifting the EBIT margin by two percentage points to 14%. Profit after tax (PAT) increased by Rs 37 crore to Rs 92 crore, and PAT margin rose to 10% from 8%, according to the presentation's IGAAP-equivalent reconciliation.
The presentation also reconciles these figures with Indian Accounting Standards (Ind AS) results. Under Ind AS, IndiQube reported revenue from operations of Rs 895 crore and a loss after tax of Rs 30 crore in H1 FY27, compared with Rs 659 crore of revenue and a Rs 67 crore loss in H1 FY26. The presentation separately identifies right-of-use depreciation and interest on lease liabilities in this accounting view.
Why did IndiQube's PAT grow faster than revenue?
IndiQube's IGAAP-equivalent EBIT grew 48%, compared with 35% growth in revenue, resulting in a 14% EBIT margin in H1 FY27 versus 12% a year earlier. EBITDA increased by Rs 52 crore to Rs 191 crore, but its margin was unchanged at 21%, meaning the reported margin expansion occurred after EBITDA.
Depreciation and amortisation in the IGAAP-equivalent statement rose to Rs 83 crore in H1 FY27 from Rs 62 crore in H1 FY26. Finance costs declined to Rs 17 crore from Rs 20 crore, while profit before tax increased to Rs 105 crore from Rs 62 crore. Tax expense was Rs 13 crore, compared with Rs 7 crore in the prior-year half.
The Ind AS reconciliation includes Rs 300 crore of right-of-use depreciation and Rs 239 crore of interest on lease liabilities in H1 FY27. These entries accompany an Ind AS loss before tax of Rs 38 crore, while the IGAAP-equivalent statement shows profit before tax of Rs 105 crore. IndiQube presents the two accounting views separately in its half-year reconciliation.
How did IndiQube's cash earnings change in H1 FY27?
IndiQube's adjusted cash EBIT rose 56% to Rs 178 crore in H1 FY27 from Rs 114 crore in H1 FY26, and its adjusted cash EBIT margin rose to 20% from 17%. Cash EBIT, before income on finance leases, increased to Rs 168 crore from Rs 106 crore.
Revenue in the cash-EBIT calculation was Rs 895 crore in H1 FY27, against Rs 659 crore in H1 FY26. Expenses increased to Rs 339 crore from Rs 263 crore, while payments of lease liabilities rose to Rs 387 crore from Rs 290 crore. Income on finance leases contributed Rs 9 crore, compared with Rs 8 crore a year earlier.
The quarterly figures show that adjusted cash EBIT was Rs 75 crore in Q1 FY27 and Rs 103 crore in Q2 FY27, compared with Rs 62 crore in Q2 FY26. Q2 FY27 revenue from operations was Rs 472 crore, up from Rs 350 crore a year earlier, while adjusted cash EBIT margin rose to 22% from 18%.
Got a follow-up? Ask IRIS
What did IndiQube report on cash flow and borrowing costs?
IndiQube reported Rs 509 crore of cash generated from operations in H1 FY27 and Rs 122 crore of free cash flow from operations after Rs 387 crore of lease-liability payments, including interest. It spent Rs 157 crore on interiors capital expenditure and Rs 46 crore on solar capital expenditure, resulting in overall free cash flow of Rs (81) crore.
Total capital expenditure was Rs 203 crore in H1 FY27. The presentation shows that free cash flow turned negative after the interiors and solar spending, following the positive pre-capex free cash flow from operations figure of Rs 122 crore. It does not disclose a completion timetable or return target for the solar expenditure.
Gross debt was Rs 288 crore in H1 FY27, compared with Rs 278 crore in H1 FY26. Net debt was Rs (15) crore versus Rs (213) crore, net worth increased to Rs 1,254 crore from Rs 1,090 crore, and the debt-to-equity ratio was (0.01) compared with (0.20). The stated cost of borrowing declined to 8.25% from 9.4%.
What operating capacity did IndiQube report alongside the results?
IndiQube reported 10.86 million square feet of area under management at Q2 FY27, up 19% from 9.14 million square feet in Q2 FY26. Its footprint included 138 centres across 17 cities and 241,000 seats, compared with 125 centres and more than 203,000 seats a year earlier.
Steady-state occupancy increased to 91% in Q2 FY27 from 89% in Q2 FY26, although overall occupancy declined to 86% from 87%. IndiQube cited approximately 5,000 seats added in Chennai and approximately 3,000 seats in Hyderabad through office-supply sign-ups, alongside approximately 2,000 design-and-build seats signed across several metros.
Of the 10.86 million square feet under management, 8.19 million square feet was rent-paying area and 2.67 million square feet was letter-of-intent signed future supply, representing 59,000 future seats. Rent-yielding area was 7.05 million square feet, leaving 3.81 million square feet of stated growth headroom across 85,000 seats. IndiQube says this letter-of-intent signed supply is expected to become operational over the next 12 to 18 months.
Conclusion
IndiQube's H1 FY27 IGAAP-equivalent results show revenue rising 35%, while PAT rose 66% and EBIT margin expanded to 14% from 12%. The half-year also delivered adjusted cash EBIT of Rs 178 crore at a 20% margin, compared with Rs 114 crore and a 17% margin in H1 FY26, while EBITDA margin remained 21%.
The next disclosed operating development to watch is the conversion of 2.67 million square feet of letter-of-intent signed supply, equal to 59,000 future seats, which IndiQube says should become operational over the next 12 to 18 months. Overall occupancy was 86% in Q2 FY27, and the effect of the planned supply addition on occupancy and cash flow remains a relevant disclosed measure to monitor.