










Insolation Energy Ltd borrowings reach Rs 1,473 crore H1FY27
Key highlights
- Insolation Energy’s combined long-term and short-term borrowings were Rs 1,473 crore at H1FY27, up from Rs 841 crore at FY2026.
- Long-term borrowings increased to Rs 965 crore at H1FY27 from Rs 471 crore at FY2026.
- Trade receivables reached Rs 538 crore and inventories reached Rs 460 crore at H1FY27.
- Capital work-in-progress rose to Rs 208 crore at H1FY27 from Rs 73 crore at FY2026.
powered by IRIS
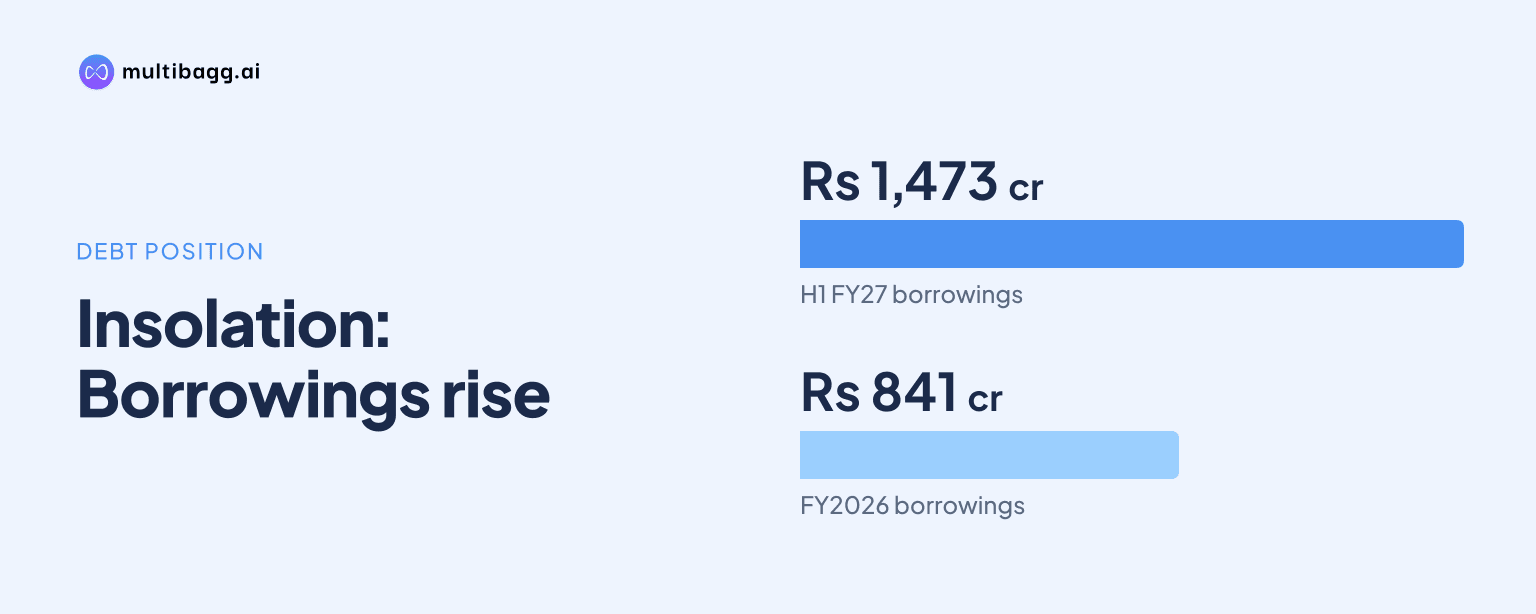
Insolation Energy reported Rs 1,473 crore of combined borrowings at H1FY27, up from Rs 841 crore at FY2026, with long-term borrowings rising to Rs 965 crore and short-term borrowings reaching Rs 508 crore. Capital work-in-progress, inventories and trade receivables also increased over the same period.
Know Insolation Energy inside out
Results, valuation, peers and who's buying, in one view.
Why did Insolation Energy’s borrowings rise in H1FY27?
Insolation Energy’s reported borrowings rose by Rs 632 crore between FY2026 and H1FY27, consisting of a Rs 494 crore increase in long-term borrowings and a Rs 138 crore increase in short-term borrowings. Combined borrowings total Rs 1,473 crore at H1FY27, calculated from Rs 965 crore of long-term borrowings and Rs 508 crore of short-term borrowings. The corresponding FY2026 balances were Rs 471 crore and Rs 370 crore.
Long-term borrowings recorded the larger movement, increasing from Rs 12 crore in FY2025 to Rs 471 crore in FY2026 and Rs 965 crore at H1FY27. Short-term borrowings also increased, from Rs 97 crore in FY2025 to Rs 370 crore in FY2026 and Rs 508 crore at H1FY27. The presentation does not provide a maturity schedule, interest rates, lender details or a project-by-project allocation for these facilities.
How did Insolation Energy’s liabilities change from FY2026?
Insolation Energy’s total non-current liabilities increased to Rs 1,101 crore at H1FY27 from Rs 591 crore at FY2026, while total current liabilities rose to Rs 1,066 crore from Rs 756 crore. The non-current increase included the Rs 494 crore rise in long-term borrowings, alongside lease liabilities increasing to Rs 60 crore from Rs 47 crore and other long-term liabilities increasing to Rs 18 crore from Rs 12 crore.
Current obligations moved differently across categories. Trade payables rose by Rs 200 crore to Rs 493 crore at H1FY27, while short-term provisions increased to Rs 10 crore from Rs 7 crore. Other current liabilities declined to Rs 55 crore from Rs 86 crore. Trade payables and short-term borrowings together represented Rs 1,001 crore of the Rs 1,066 crore current-liability total at H1FY27.
Total equity increased to Rs 872 crore at H1FY27 from Rs 808 crore at FY2026. Other equity rose to Rs 848 crore from Rs 785 crore, while share capital remained Rs 22 crore and non-controlling interest increased to Rs 2 crore from Rs 1 crore. Total equity and liabilities expanded to Rs 3,039 crore from Rs 2,155 crore over the same period.
Got a follow-up? Ask IRIS
Where did Insolation Energy’s balance-sheet assets increase?
Insolation Energy’s asset base increased across both non-current and current categories, with total assets rising by Rs 884 crore from FY2026 to Rs 3,039 crore at H1FY27. Capital work-in-progress, or CWIP, increased to Rs 208 crore from Rs 73 crore, while property, plant and equipment increased to Rs 508 crore from Rs 474 crore. CWIP therefore rose by Rs 135 crore during H1FY27, although the presentation does not identify the underlying project or asset.
Working-capital balances also expanded. Trade receivables increased to Rs 538 crore at H1FY27 from Rs 281 crore at FY2026, a Rs 257 crore change, and inventories rose to Rs 460 crore from Rs 379 crore. Other current assets increased to Rs 248 crore from Rs 208 crore. These three categories totalled Rs 1,246 crore at H1FY27, compared with Rs 868 crore at FY2026.
Cash and cash equivalents increased to Rs 603 crore from Rs 521 crore despite the higher receivables, inventory and CWIP balances. Other non-current assets rose to Rs 329 crore from Rs 83 crore, while non-current investments declined to Rs 33 crore from Rs 36 crore. The presentation reports the asset categories and balances, but does not link the Rs 965 crore of long-term borrowings specifically to CWIP, a cell project or another named use.
What did H1FY27 earnings show alongside higher borrowings?
Insolation Energy reported Rs 1,582 crore of revenue and Rs 140 crore of earnings before interest, tax, depreciation and amortisation, or EBITDA, in H1FY27. EBITDA margin was 8.9% in H1FY27, compared with 14.0% in FY2026. Since H1FY27 covers a half year and FY2026 covers a full financial year, the presentation permits a reported margin comparison but does not provide a prior-year half-year margin in this table.
Finance cost was Rs 25 crore in H1FY27, above the Rs 24 crore reported for the full FY2026. Depreciation and amortisation was Rs 35 crore in H1FY27, compared with Rs 36 crore in FY2026, resulting in earnings before interest and tax of Rs 106 crore for the half year. Profit before tax was Rs 80 crore and net profit was Rs 63 crore in H1FY27.
Revenue increased from Rs 1,343 crore in FY2025 to Rs 2,163 crore in FY2026, while EBITDA increased from Rs 170 crore to Rs 305 crore. Over the same reporting sequence, combined borrowings rose from Rs 109 crore in FY2025 to Rs 841 crore in FY2026 and Rs 1,473 crore at H1FY27. The presentation does not state a target leverage level or a timetable for reducing borrowings.
Conclusion
The H1FY27 balance sheet shows expansion in financing, asset and operating balances: combined borrowings reached Rs 1,473 crore, total assets reached Rs 3,039 crore and total equity reached Rs 872 crore. Long-term borrowings made the largest contribution to the increase in borrowings, while trade receivables of Rs 538 crore, inventories of Rs 460 crore and CWIP of Rs 208 crore also increased from FY2026.
The next disclosures to watch are details on debt maturities, borrowing costs and the use of funds, particularly as finance cost reached Rs 25 crore in H1FY27. The supplied presentation does not disclose a repayment plan, leverage target, project-specific debt allocation or scheduled financing event, leaving those matters unresolved at the reported H1FY27 date.