










IRM Energy H1 EBITDA More Than Doubles, Margin Reaches 16.5%
Key highlights
- IRM Energy reported H1 FY27 EBITDA of Rs 109 crore, up 108% year on year.
- H1 FY27 EBITDA margin reached 16.5%, up 646 basis points year on year.
- CNG volume grew 23% in H1 FY27 and represented about 66% of total volume.
- Q2 FY27 sales volume reached 61.23 MMSCM, up 12% year on year.
powered by IRIS
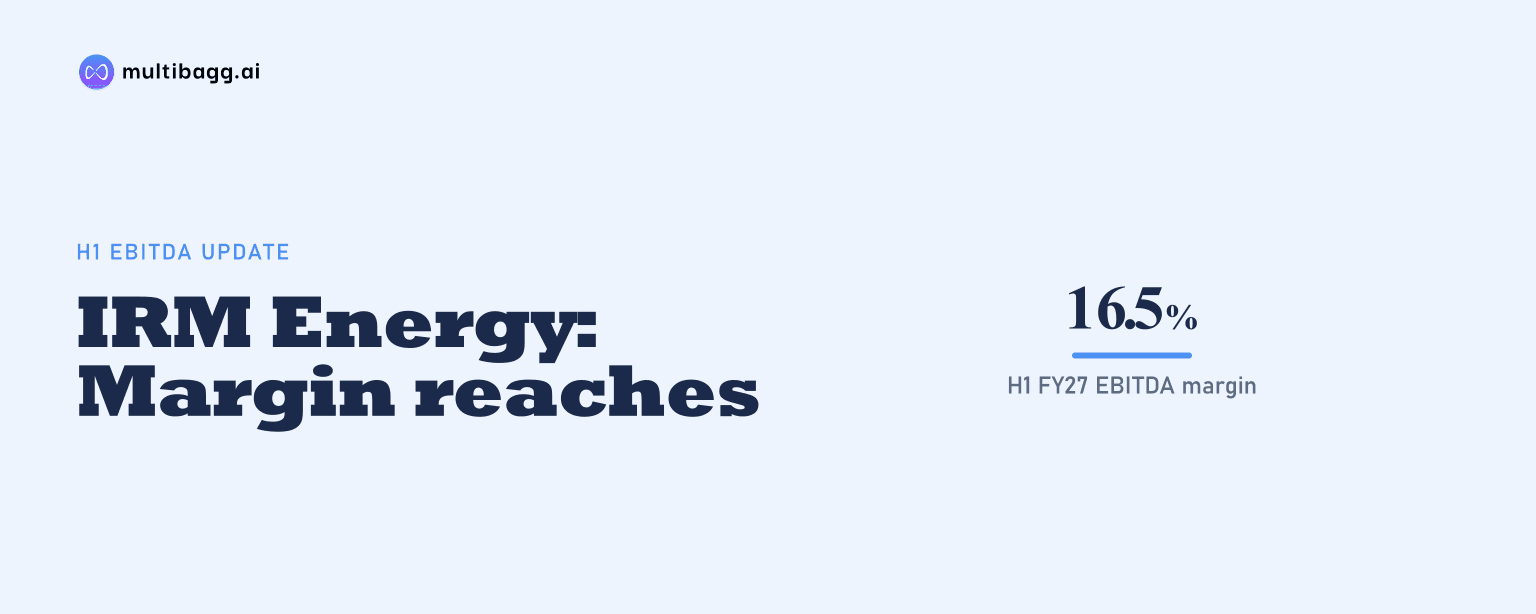
IRM Energy Limited more than doubled earnings before interest, tax, depreciation and amortisation, or EBITDA, in H1 FY27, reporting a 108% year-on-year rise to Rs 109 crore and a 646-basis-point margin expansion to 16.5%. Revenue from operations increased 26% to Rs 660 crore in the half year ended September 30, 2026, as compressed natural gas, or CNG, and commercial piped natural gas, or PNG, volumes rose.
Know IRM Energy inside out
Results, valuation, peers and who's buying, in one view.
Why did IRM Energy’s H1 FY27 EBITDA more than double?
IRM Energy’s H1 FY27 EBITDA rose faster than revenue because CNG and commercial PNG grew, while sales mix, gas sourcing and network utilisation improved. Revenue from operations increased 26% year on year to Rs 660 crore, compared with a 108% increase in EBITDA to Rs 109 crore. Management attributed the difference to improved mix, disciplined sourcing and operating leverage from the expanding network.
The EBITDA margin reached 16.5%, up 646 basis points from the prior-year first half. Profit after tax, or PAT, was reported at Rs 59 crore by the chief executive officer, up 124% year on year, with a 9% PAT margin. The chief financial officer later gave H1 PAT as Rs 60 crore, up 111%, also with a 9% margin, creating a discrepancy in the call transcript.
MMSCM means million metric standard cubic metres. The 82-percentage-point gap between revenue growth of 26% and EBITDA growth of 108% shows that the H1 improvement was not driven by sales growth alone. Management did not quantify the individual rupee contribution from mix, sourcing or network utilisation.
Which segments lifted IRM Energy’s volumes and sales mix?
CNG was IRM Energy’s main volume driver in H1 FY27, increasing 23% year on year and representing about 66% of total volume. Commercial PNG volume rose 61%, while overall H1 sales volume increased 10% to 120.16 MMSCM. Management said industrial PNG remained affected by relative fuel economics, although it recovered sequentially in Q2 FY27.
Q2 FY27 sales volume reached an all-time high of 61.23 MMSCM, up 12% year on year. That quarterly growth rate was above the 10% H1 rate, with CNG and commercial PNG providing the principal support. Management said it was seeking to improve industrial PNG competitiveness through gas-sourcing optimisation and customer engagement because alternative fuel economics remained a challenge.
The geographical mix also changed in H1 FY27. Banaskantha contributed about 47% of volume, Fatehgarh Sahib 33%, Diu and Gir Somnath 9%, and Namakkal and Tiruchirappalli, or NT, 11%. NT accounted for approximately 6% of total volume in FY26, so its contribution increased by about 5 percentage points as the newer network was monetised.
How did IRM Energy’s Q2 FY27 profit compare with Q1 and last year?
IRM Energy’s Q2 FY27 EBITDA was Rs 47 crore, up 77% year on year but below Rs 62 crore in Q1 FY27. Management attributed the Rs 15 crore sequential moderation to changed gas-sourcing costs and allocation, along with currency movement. Despite that decline, Q2 EBITDA margin rose 388 basis points year on year to 14.2%.
Q2 revenue from operations, net of excise duty, rose 29% year on year to Rs 334 crore. PAT more than doubled to Rs 26 crore and the PAT margin was 7.7%. EBITDA per standard cubic metre, or SCM, increased to Rs 7.73 from Rs 4.89 in Q2 FY26, a rise of Rs 2.84 per SCM.
The Q2 EBITDA margin of 14.2% was below the H1 margin of 16.5%, consistent with management’s statement that gas costs and allocation changes affected the second quarter. The year-on-year comparisons nevertheless show higher profitability in Q2 FY27 than a year earlier, alongside the record quarterly sales volume of 61.23 MMSCM.
Got a follow-up? Ask IRIS
What network expansion supported IRM Energy’s growth?
IRM Energy expanded its CNG and PNG network in H1 FY27, increasing CNG stations 34% year on year to 156 and dispensing points 36% to 576. The company said its CNG network had grown at a 28% compound annual growth rate over six years. Management linked the larger network to operating leverage and future volume capacity.
The medium-density polyethylene, or MDPE, pipeline network increased 20% to 7,313 kilometres, while the steel pipeline network rose 17% to 3,441 inch-kilometres. Domestic PNG connections increased 14%, commercial connections 48%, and industrial connections 8%. The 48% increase in commercial connections coincided with 61% commercial PNG volume growth, while industrial volume remained pressured by competing fuels.
In NT, IRM Energy signed a memorandum of understanding with Tamil Nadu State Transport Corporation for captive CNG dispensing. The company facilitated the conversion of 83 buses, taking the CNG fleet to 183 buses in Namakkal and 55 in Tiruchirappalli. It also said connectivity work had begun for arrangements with Indian Oil Corporation in NT and GAIL in Diu and Gir Somnath.
What does gas sourcing mean for IRM Energy’s H2 FY27 outlook?
Management expects a temporary gas-supply disruption and higher gas costs to affect IRM Energy in Q3 FY27 after the government revised high-pressure, high-temperature, or HPHT, gas-allocation methodology in September 2026. Management said reduced availability affected volumes for about a fortnight at the beginning of Q3. Phased implementation introduced in October gave city gas distribution companies additional time to realign sourcing.
In Q2 FY27, management initially said spot gas represented about 0.5% of total requirements. In a later detailed response, it put the portfolio at about 21% administered price mechanism gas, 13% new-well gas, 33% HPHT gas, 30% liquefied natural gas, or LNG, and 1% to 2% spot purchases. The different spot-gas figures were both disclosed during the same call.
Management put average gas cost at about US$9.5 per million British thermal units in Q2 FY27. It said administered price mechanism gas was capped at US$7 per million British thermal units, new-well gas cost about US$10.2, HPHT about US$8.9, and LNG between US$11 and US$12. Management also said it had sourcing arrangements through Shell India and GSPC until 2030, alongside newer contracts with Indian Oil Corporation and GAIL.
IRM Energy reported total debt of about Rs 45 crore at September 2026, against Rs 253 crore of cash, bank balances and mutual-fund investments, which management described as a net debt-free position. Of Rs 496 crore in initial public offering proceeds, Rs 358.68 crore had been used by September 30, 2026, leaving about Rs 137.08 crore for NT network development.
Conclusion
IRM Energy’s H1 FY27 performance shows profit growth outpacing revenue growth, with EBITDA rising 108% to Rs 109 crore against a 26% increase in revenue. CNG volume growth of 23%, commercial PNG growth of 61%, and NT’s increase to 11% of total volume from about 6% in FY26 were the reported operational changes behind the improved mix and margin.
The next reported test is Q3 FY27, when management expects some impact from the September 2026 HPHT allocation disruption and higher gas costs. Management’s disclosed priorities for H2 FY27 are diversified sourcing, volume growth across segments, infrastructure ramp-up in NT and delivery of its capital-expenditure plan, including the remaining Rs 137.08 crore of IPO proceeds for NT.