










Karamtara cuts largest customer share to 7.98% in FY26
Key highlights
- Karamtara’s largest customer contributed 7.98% of revenue in FY26, down from 18.93% in FY24.
- Karamtara’s top 10 customers represented 48.63% of revenue in FY26 versus 63.47% in FY24.
- Karamtara had 65 solar-product customers in FY26, compared with 48 in FY24.
- Average solar revenue per Karamtara customer rose to Rs 52.402 crore in FY26 from Rs 41.305 crore in FY24.
powered by IRIS
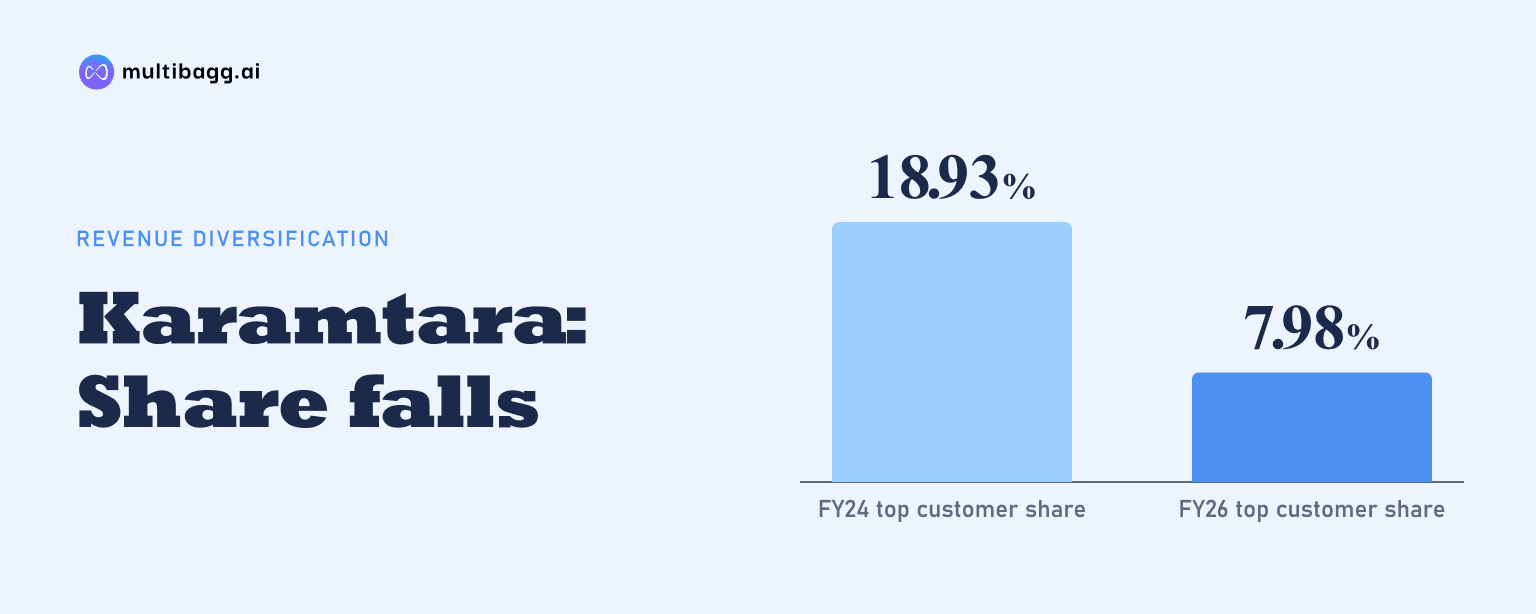
KARAMTARA reduced its largest customer’s revenue contribution to 7.98% in FY26 from 18.93% in FY24, a decline of 10.95 percentage points over two years. Karamtara also reported that its top 10 customers accounted for 48.63% of revenue in FY26, compared with 63.47% in FY24, while average solar revenue per customer increased.
Know Karamtara Engineering inside out
Results, valuation, peers and who's buying, in one view.
How much did Karamtara reduce its largest customer dependence?
Karamtara cut the largest customer’s contribution to revenue from 18.93% in FY24 to 7.98% in FY26. This is the presentation’s direct measure of the change in customer concentration, with the share represented by the single biggest customer lower by 10.95 percentage points across the two reported financial years.
The disclosed figures describe revenue contribution rather than the identity of the customer or the value of sales made to it. Karamtara does not provide total revenue, the largest customer’s name, or a yearly revenue bridge on the cited pages. The available comparison is therefore limited to the customer’s percentage of revenue: 18.93% in FY24 and 7.98% in FY26.
A lower share for the largest customer does not establish why the change occurred. It could reflect revenue growth from other customers, reduced purchases by that account, or both, but the presentation does not separate those drivers. What is reported is a marked shift in the revenue share attached to one customer between FY24 and FY26.
How did Karamtara’s broader customer mix change?
Karamtara’s top 10 customers accounted for 48.63% of revenue in FY26, down from 63.47% in FY24, while other customers’ share increased to 51.37% from 36.53%. The 14.84-percentage-point reduction in the top-10 share is broader than the decline recorded for the single largest customer and indicates that revenue became more distributed across the disclosed customer categories.
The other-customer category crossed half of revenue in FY26 at 51.37%, whereas it represented 36.53% in FY24. This means customers outside the top 10 collectively accounted for a larger share than the top 10 in FY26. The presentation does not state whether the FY24 and FY26 top-10 lists contained the same companies, so the figures show concentration by category rather than retention of particular accounts.
For solar products, the number of customers rose from 48 in FY24 to 73 in FY25 before declining to 65 in FY26. Even with the FY26 count eight customers below FY25, it remained 17 above FY24. The company’s customer-count disclosure applies specifically to solar products, whereas the customer-contribution percentages are presented as revenue measures without a product-specific label.
Did Karamtara generate more solar revenue per customer?
Karamtara reported average solar revenue per customer of Rs 52.402 crore in FY26, up from Rs 41.305 crore in FY24. The increase of Rs 11.097 crore per customer occurred alongside an increase in the solar customer count from 48 to 65 over the same period.
The combination of 65 solar customers in FY26 and higher average solar revenue per customer than FY24 is consistent with a larger reported average across that product category. However, the presentation does not disclose the distribution of solar revenue among those 65 customers, nor does it provide an FY25 average-revenue figure. It therefore cannot show whether the higher average came from broadly higher sales, a changed customer mix, or a limited number of larger orders.
The customer-count movement differed after FY25. Solar customers fell from 73 in FY25 to 65 in FY26, while the disclosed FY26 average of Rs 52.402 crore was higher than FY24’s Rs 41.305 crore. Since Karamtara does not disclose FY25 solar revenue per customer, the presentation does not permit a year-on-year comparison of average customer spending from FY25 to FY26.
Got a follow-up? Ask IRIS
What supports Karamtara’s customer reach and retention?
Karamtara reported serving customers across more than 50 international locations and listed subsidiaries in Italy, the United States and the Kingdom of Saudi Arabia. It said it has established market presence particularly in the United States, Europe, the Middle East and Latin America, providing geographic context for its stated solar customer base of 65 in FY26.
The company described itself as an approved supplier and critical partner to many leading solar energy companies globally. It also reported that 45.49% of revenue from operations in FY26 was attributable to customers associated with Karamtara for at least two years. This is a revenue-attribution measure for customers with a relationship duration of two years or more, rather than a count of customers retained from a prior period.
Karamtara’s manufacturing footprint includes solar products at Bhachau, Gujarat, and Tarapur, Maharashtra, plus a solar-products facility under construction in Saudi Arabia. As of 30 September 2026, solar represented 60% of total saleable capacity, or 527,600 metric tonnes per annum, out of total saleable capacity of 879,800 metric tonnes per annum. These capacity figures set out the production base but do not disclose order backlog, utilisation or sales by country.
Management said Karamtara would continue to leverage its international presence to increase market share. The presentation also says Karamtara has exported to more than 50 countries and is one of the largest exporters of solar products from India, but it gives no country-level revenue split. The disclosed customer data therefore demonstrates reach across locations without quantifying dependence on any one export market.
Conclusion
Karamtara’s FY24-to-FY26 disclosures show a less concentrated reported revenue mix: the largest customer’s share fell from 18.93% to 7.98%, the top-10 share declined from 63.47% to 48.63%, and the other-customer share rose to 51.37%. At the same time, the solar customer base increased from 48 to 65 and average solar revenue per customer rose from Rs 41.305 crore to Rs 52.402 crore.
The next disclosed items to watch are whether management’s plan to use its presence across more than 50 international locations translates into further market-share gains, and the progress of facilities under construction in Saudi Arabia, Bhachau and Tarapur. Solar capacity was 527,600 metric tonnes per annum as of 30 September 2026, but the presentation does not provide customer-concentration targets, utilisation targets or an order-book measure.